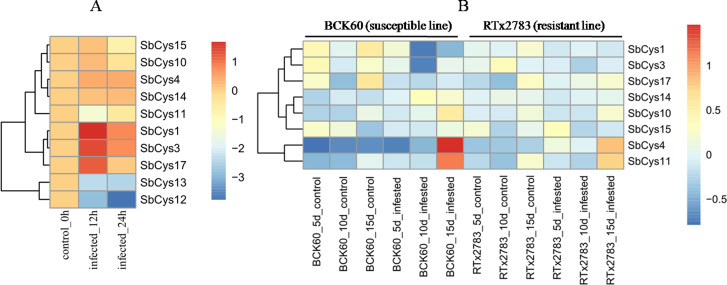
Figure 9. Hierarchical clustering of the expression profiles of SbCys genes under biotic stresses.
(A) The expression changes in SbCys genes at 0, 12, and 24 h with Bipolaris sorghicola infection. (B) The expression changes of SbCys genes at 5, 10, 15 days with sugarcane aphid infestation. Log transform data was used to create the heatmap. The scale bar represents the fold change (color figure online). Blue blocks indicate low expression and red blocks indicate high expression (color figure online).

