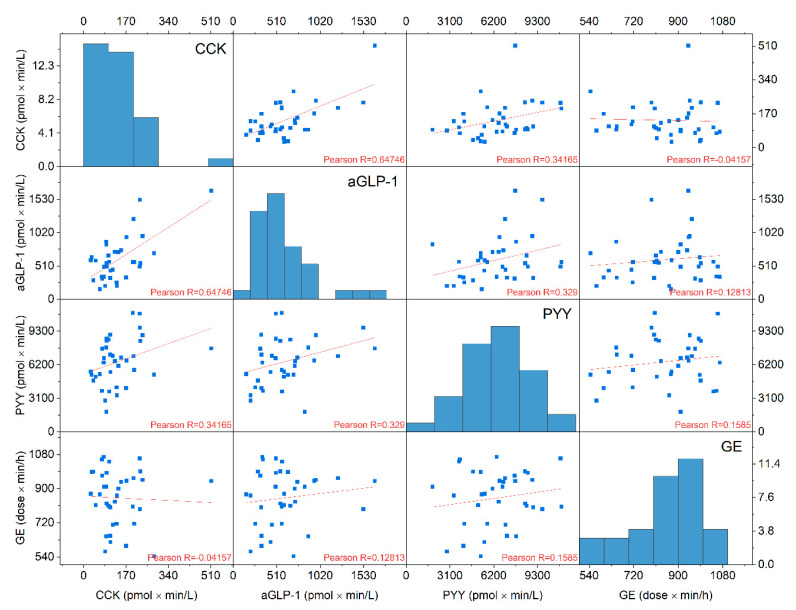
Figure 3.
Correlation matrix of cholecystokinin (CCK), active glucagon-like peptide-1 (aGLP-1), peptide tyrosine tyrosine (PYY), and gastric emptying (GE). iAUC 0–60 min values from n = 36 samples from all xylitol treatments were used. CCK, aGLP-1 and PYY were weakly negatively correlated to gastric emptying (Pearson’s R=−0.041, R = 0.128 and R = 0.158, respectively). In the diagonal, histograms of distribution of individual values are shown. The x-axes of the histograms are identical with that of other plots of the same column. The y-axes of the histogram denotes the number of individual samples iAUC values in the interval of the width of the respective histogram bar.

