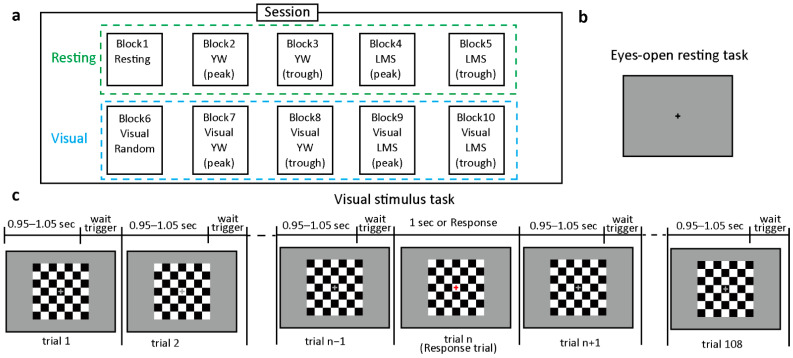
Figure 2.
Overview of the experimental sessions and trials. (a) shows a session divided into resting (green) and visual (blue) tasks, each with five blocks. The instantaneous phase prediction algorithm was implemented utilizing four distinct models: YW peak, YW trough, LMS peak, and LMS trough. “Peak” means a positive peak or 0 rad, while “trough” depicts a negative peak or pi rad. (b) shows an eye-open resting condition. (c) shows trials of the visual stimulus condition. The visual stimulus task includes passive and response trials. The stimulus comprised of a checkerboard with a gray fixation cross at the center in passive trials. While response trials are shown with a red fixation cross at the center. Each trial took an average of 1.05 s.

