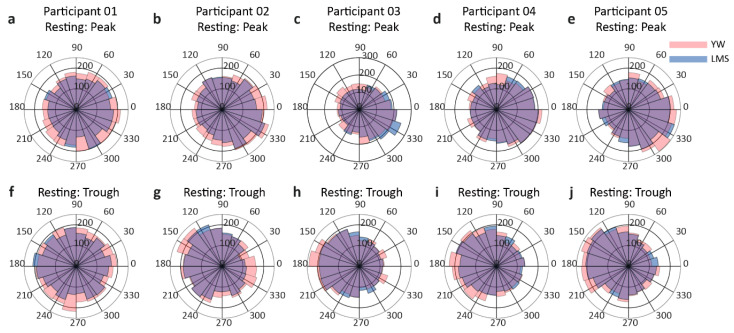
Figure 4.
Rose plots for the resting conditions for each participant. The upper row (a–e) shows the rose plots for each participant’s peak condition, while the lower row (f–j) depicts the rose plot for the trough condition for each participant. The peach color indicates the YW method, while purple indicates the LMS method. The violet color depicts the overlapping region. For the peak condition, the rose plots are inclined towards 0 rad and for the trough condition, the rose plots show an inclination towards pi rad.

