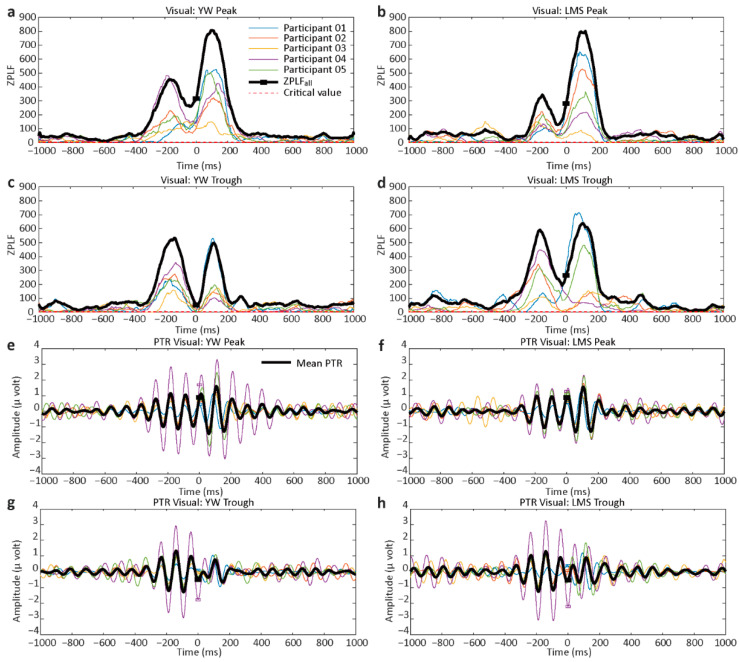
Figure 5.
ZPLF and PTR for the visual task. (a–d) show ZPLF results for both YW and LMS methods with peak and trough conditions, while (e–h) show the phase-triggered response (PTR) for YW and LMS methods for the peak and trough conditions. ZPLF shows a second peak around 100 ms for the visual task. The small black square shows time-zero. The bold black signals in (e–h) show the mean PTR averaged across five participants. The red dashed lines in (a–d) shows the critical value of 2.995. ZPLF larger than this critical value is considered to be statistically significant.

