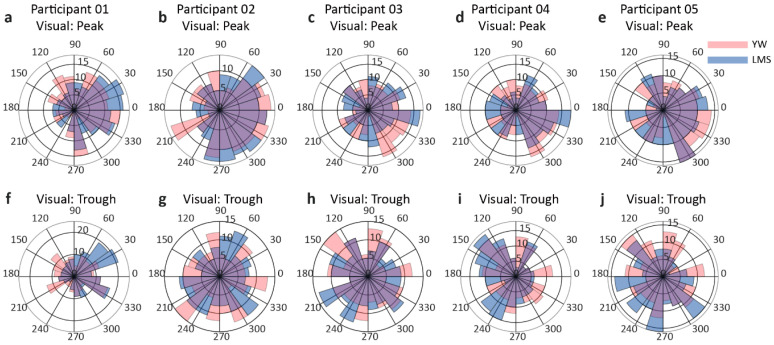
Figure 6.
Rose plots for the visual condition. The peak conditions for each participant are shown in the first row (a–e), while the trough conditions are depicted in the second row (f–j). For the peak condition, the rose plots are inclined towards 0 rad and for the trough condition, the rose plots show an inclination towards pi rad. (f) shows no tendency towards any phase angle.

