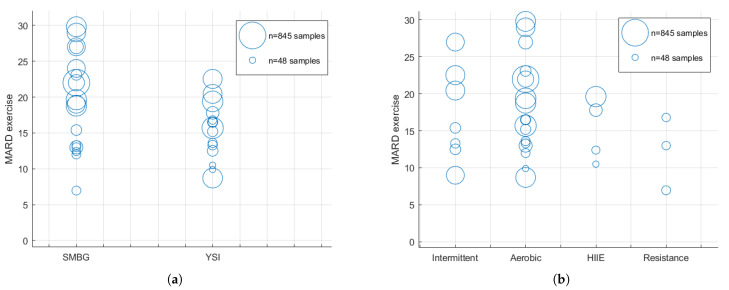
Figure 1.
Panel (a) shows the MARD for the exercise periods according to the reference used. The SMBG column displays data from studies where self-monitoring blood glucose samples were used to calculate the CGM accuracy. The YSI column stands for those studies that used gold-standard reference methods (YSI or equivalent) to calculate the CGM accuracy. Panel (b) displays MARD data for the exercise periods grouped according to the type of exercise. The radius of each bubble is proportional to the number of samples used for the computation of MARD values.

