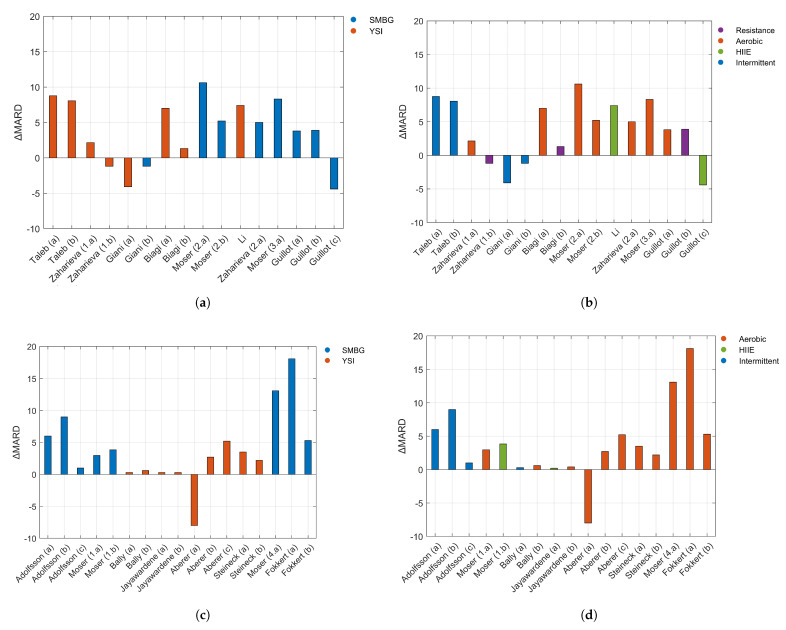
Figure 3.
Panels (a,b) display data from studies that reported the MARD for both exercise and rest. Panel (a) shows MARD according to the reference used, and Panel (b) shows the same data coloured according to the type of exercise. Panels (c,d) display data from studies that reported MARD values for exercise periods, but did not provide MARD values for resting periods. In order to calculate MARD for those studies, MARD values for exercise were paired with the MARD from the sources in Table 2. Panel (c) displays MARD according to the reference used, and Panel (d) presents the same data coloured according to the type of exercise. In Panels (a,c), YSI stands for those studies that used gold-standard reference methods (YSI or equivalent) to calculate the CGM accuracy.

