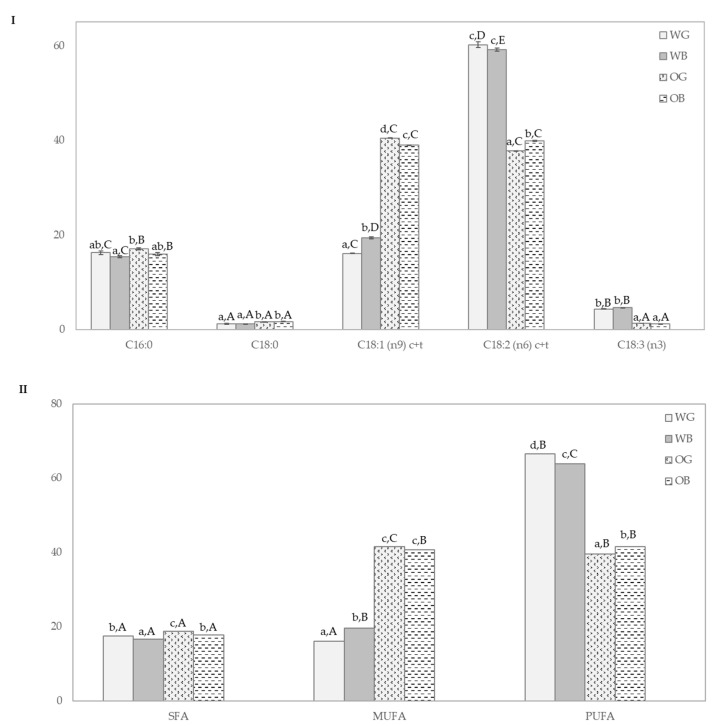
Figure 2.
Fatty acid profile of wheat grain (WG), oat grain (OG), wheat bran (WB), and oat bran (OB). (I) More abundant fatty acids: palmitic (C:16:0), stearic (C:18:0), oleic (C:18:1(n9)), linoleic (C:18:2 (n6)), and α-linolenic acids (C:18:3 (n3)) and (II) Fatty acid groups: saturated fatty acids (SFA), monounsaturated fatty acids (MUFA) and polyunsaturated fatty acids (PUFA). Results were expressed as % of total fatty acids. Different lowercase letters indicate significant differences (p < 0.05) in a given fatty acid among samples (WG, WB, OG, and OB) and capital letters indicate significant differences (p < 0.05) in a given sample (WG, WB, OG, or OB) among fatty acids (p < 0.05).

