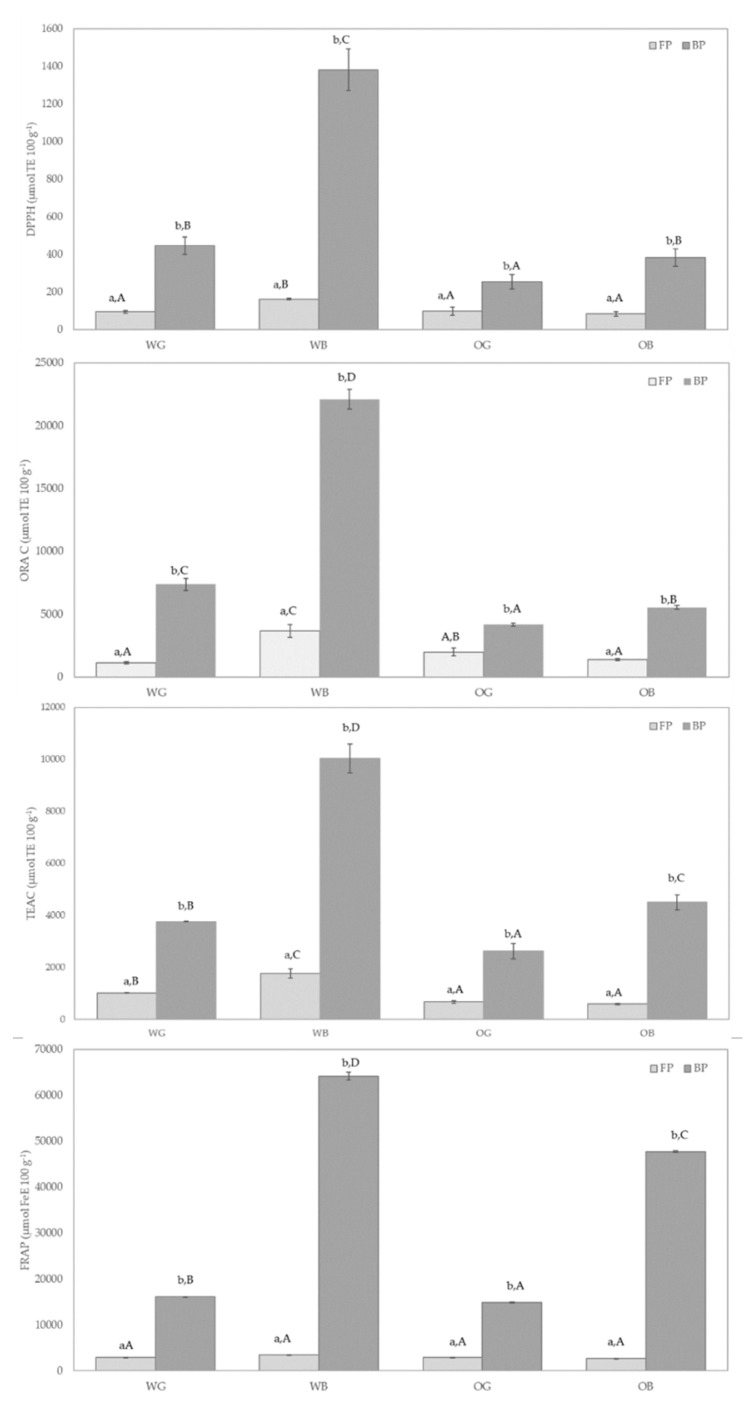
Figure 4.
DPPH, ORAC, ABTS, and FRAP values for free phenolic fraction (FP) and insoluble phenolic fraction (BP) of wheat grain (WG), oat grain (OG), and their bran, wheat bran (WB) and oat bran (OB). Results were expressed in µmol TE 100 g−1 for ORAC, DPPH, ABTS, and µmol Fe E 100 g−1 for FRAP of dry sample. Different lowercase letters indicate significant differences (p < 0.05) in a given sample (WG, WB, OG, or OB) between fractions (FP vs. BP) and capital letters indicate significant differences (p < 0.05) in a given fraction (FP or BP) among samples (WG, WB, OG, and OB).

