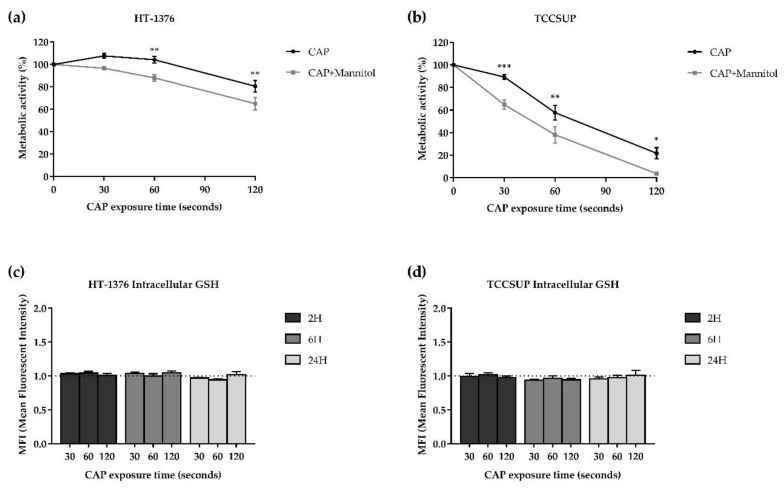
Figure 4.
CAP treatment together with D-mannitol decreased the metabolic activity in both HT-1376 (a) and TCCSUP (b) cell lines. No differences were observed in the intracellular content of GSH in both HT-1376 (c) and TCCSUP (d) cell lines. The hydroxyl radical was indirectly evaluated using D-mannitol. The cells were treated with CAP or CAP with D-mannitol (CAP + Mannitol), and the cell proliferation was accessed by MTT 24 h after CAP treatment (n = 5 independent experiments in triplicate). Exposure time-response curves were plotted, and the results are expressed as the mean ± SEM of the percentage of metabolic activity normalized to control. Statistical differences between CAP and CAP + Mannitol are represented, being p value reported as * p ≤ 0.05, ** p ≤ 0.01, *** p ≤ 0.001. Intracellular content of GSH was evaluated by fluorescence using the fluorescent orange mercury compound, 2, 6, and 24 h after CAP treatment (n ≥ 4 independent experiments in triplicate). Results are expressed as the mean ± SEM of the MFIs normalized to control.

