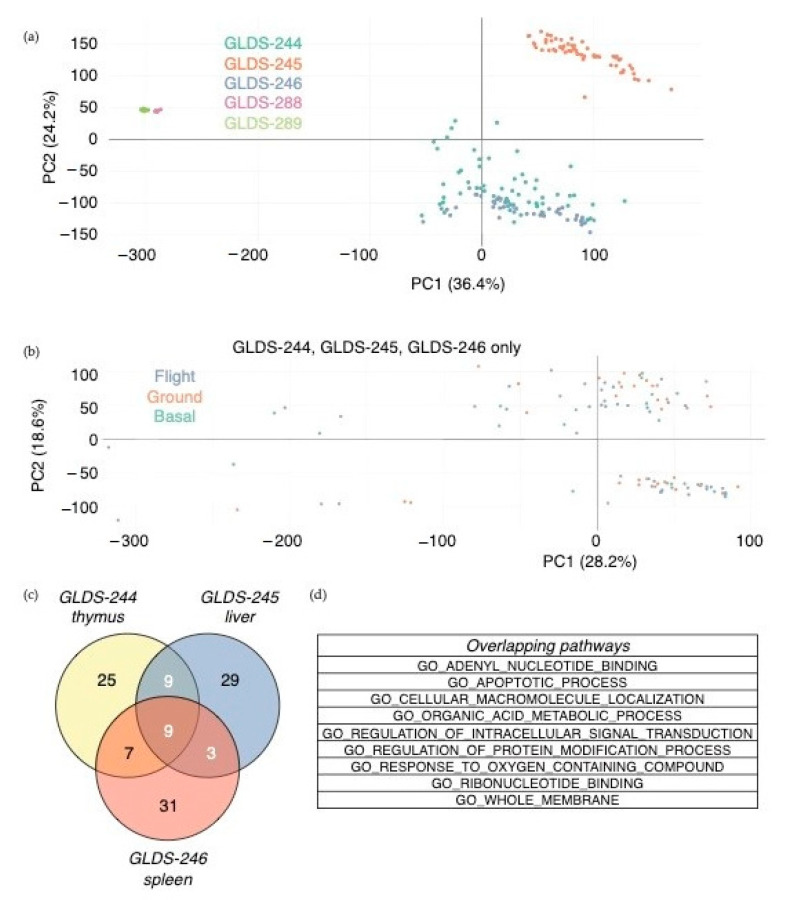
Figure 2.
Transcriptomic analysis of spaceflight-associated changes in gene expression. (a) Principal component analysis of all samples, colored by the dataset. (b) Principal component analysis of datasets GLDS-244, -245, and -246, colored by flight condition. (c,d) Overlapping gene sets between datasets GLDS-244, 245, and 246 out of the top 50 Gene Ontology gene sets using significantly differently expressed genes (p < 0.05) between flight and ground conditions, live animal return after 29 days on the ISS. Venn diagram showing overlapping gene sets between datasets (c) and the list of gene sets overlapping between all three datasets (d). Three out of the top 50 gene ontology (GO) gene sets overlapped between datasets GLDS-288 and -289, none of which overlapped with GLDS-244, -245, and -246.

