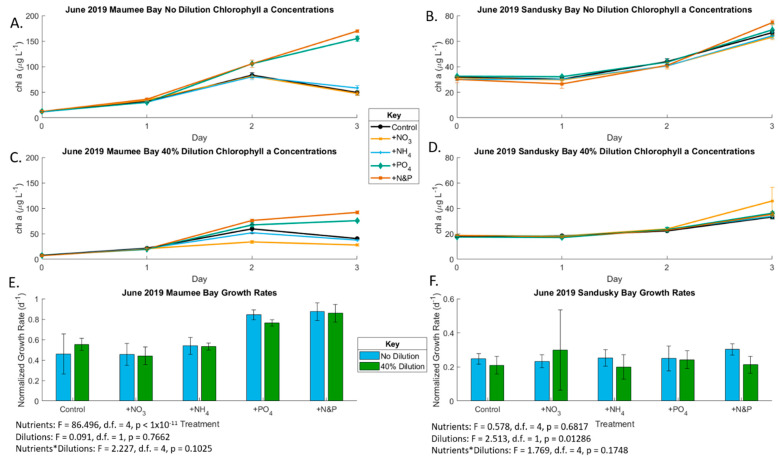
Figure 2.
Growth rates of phytoplankton, as determined by chlorophyll a accumulation during the course of incubation in the June 2019 bioassays. (A) Undiluted Maumee Bay water (also see Table S1); (B) undiluted Sandusky Bay water (also see Table S1); (C) 40% dilution Maumee Bay water (also see Table S1); (D) 40% dilution Sandusky Bay water (also see Table S1); (E) Maumee Bay growth rates under the various nutrient addition treatments at the two locations of T3 compared to T0 (also see Table S2). Error bars are standard error; (F) Maumee Bay growth rates under the various nutrient addition treatments at the two locations of T3 compared to T0 (also see Table S2). Error bars are standard error. Significances between treatments for (E,F) are from two-factor ANOVAs.

