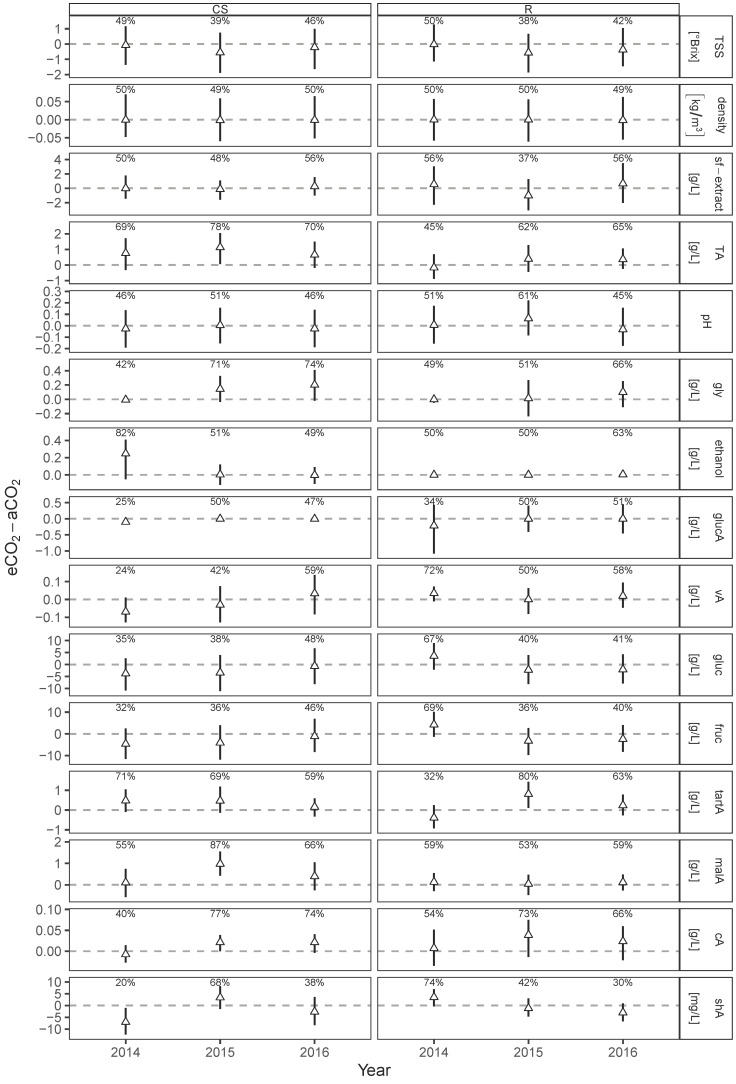
Figure 2.
Posterior predicted difference (median and 50% HDI) between eCO2 and aCO2 for each measurement year from Bayesian generalized linear mixed effects models on analyzed must parameters of Cabernet Sauvignon (CS) and Riesling (R). Percentages represent the probability of eCO2-aCO2 > 0. Filled symbols indicate “significant differences”, if the probability is >90% (positive difference) or <10% (negative difference).

