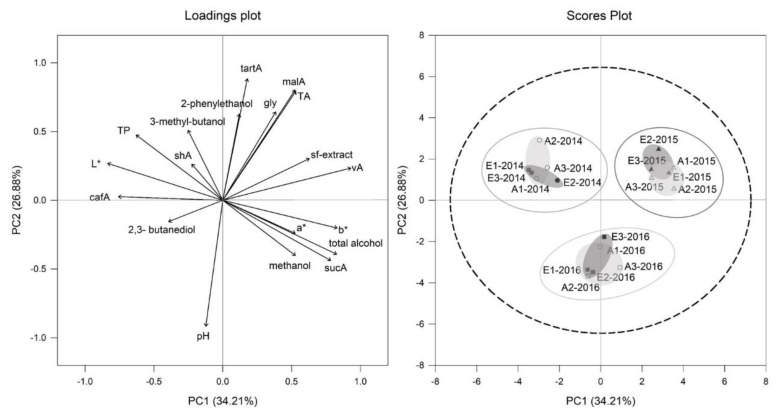
Figure 9.
Loadings and scores plot of principal component analysis (PCA) of Riesling young wines from aCO2 (open symbols) and eCO2 (filled symbols) treatment for the years 2014 (circles), 2015 (triangles) and 2016 (squares). Data represent mean values per ring and p = 0.95 for confidence level (dashed line).

