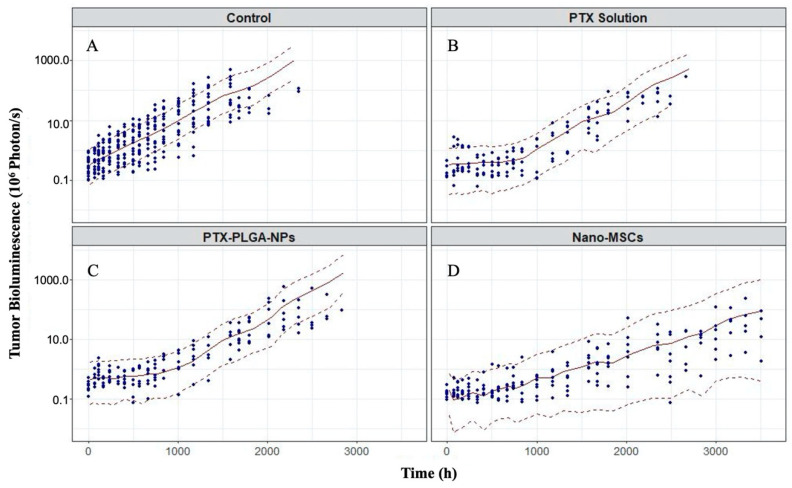
Figure 6.
Prediction-corrected visual predictive check (pcVPC) for tumor bioluminescence–time profiles in animals receiving no treatment (A), PTX solution (B), PTX-PLGA NPs (C) and nano-MSCs (D). The plots are on log scales. The dots represent observations. The red solid lines are the median of model-predicted tumor bioluminescence profile. The red dashed lines are 10th and 90th percentiles of model-predicted tumor bioluminescence profiles, respectively.

