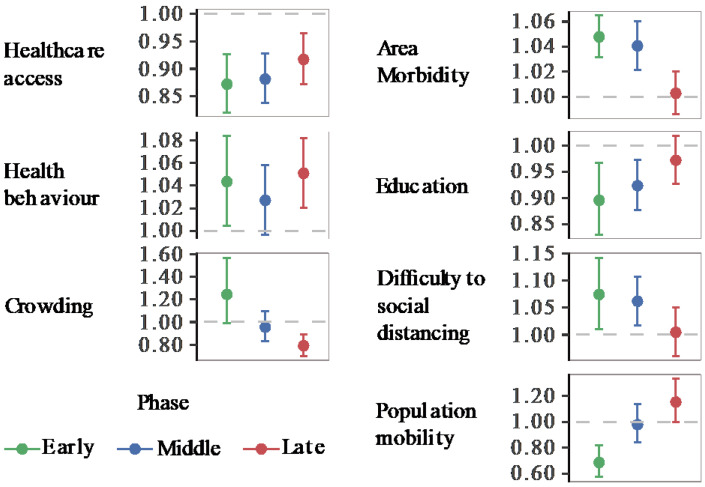
Figure 3.
Relative Risk of COVID-19 associated with area health and SES determinants (GNBR models). Each panel shows the relative risk and its 95% confidence intervals associated with each thematic area. Colours represent the pandemic’s early (20 January to 20 March 2020), middle (21 March to 15 April 2020), and late phases (16 April to 1 July 2020). The dashed line shows the reference level (1). Values over or below the reference line indicate statistically significant results at α = 0.05. Corresponding p-values can be found in Table S5.

