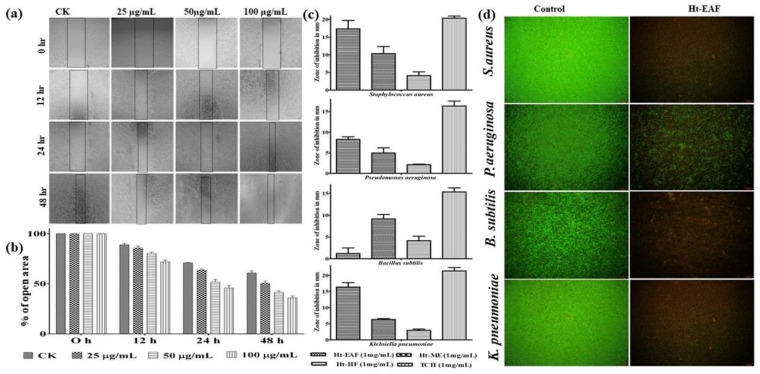
Figure 4.
(a,b) Cell migration activity of different concentrations of Ht-EAF-treated NIH3T3 cells. (c) Zone of inhibition of Ht-EAF treated with different bacterial stains. (d) Live/DeadTM BacLightTM bacterial viability assay. Data were expressed as mean ± standard deviation of three independent experiments.

