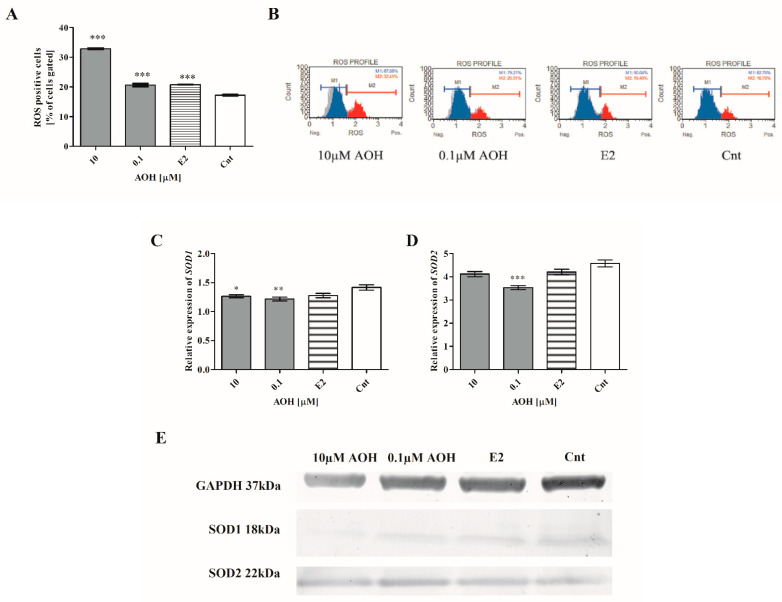
Figure 2.
AOH induces oxidative stress in mammary gland epithelial cells. (A) ROS positive cells were counted with flow cytometry and expressed as % of gated cells. The results are presented as mean ± SE. (C,D) Relative expression of SOD1 and SOD2 evaluated with RTqPCR. One-way ANOVA was used to calculate statistically significance. P lower than 0.05 was considered as statistically significant. * p < 0.05, ** p < 0.001, *** p < 0.001 as compared to control. (B) Representative results of flow cytometry results. (E) Representative results of Western blot. ROS–reactive oxygen species, AOH–alternariol, E2–10 nM estradiol, Cnt–control, SOD1–superoxide dismutase 1, SOD2–superoxide dismutase 2.

