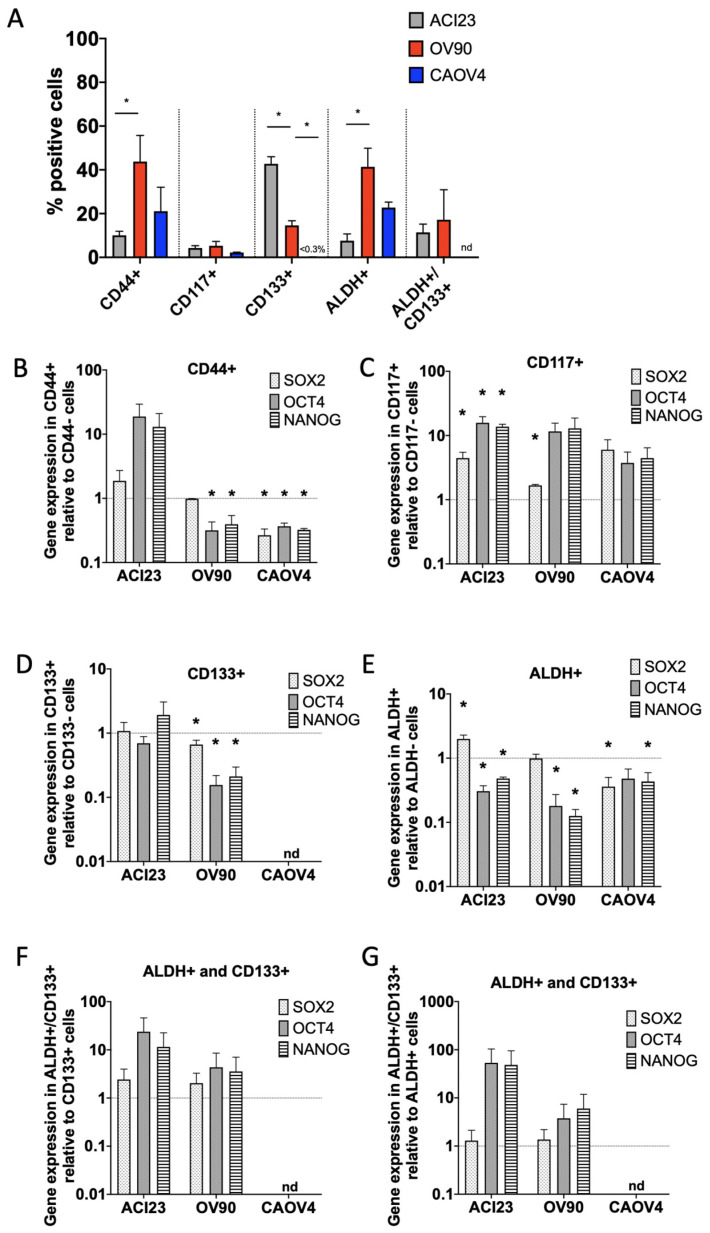
Figure 4.
CD117+ and ALDH+/CD133+ cells have elevated SOX2, OCT4 and NANOG expression. (A) Percent positive cells retrieved from cells grown in 3-D conditions for 5 days and sorted using common stem cell markers (ALDH activity or CD133, CD44, CD117 expression, or ALDH activity and CD133 expression), Student’s T-test. B–G) qRT-PCR of SOX2, OCT4 and NANOG in (B) CD44+ relative to CD44- cells, (C) CD117+ relative to CD117-cells, (D) CD133+ relative to CD133- cells, (E) ALDH+ relative to ALDH- cells, and ALDH+/CD133+ relative to (F) ALDH+ or (G) CD133+ cells (OV90 n = 2), Student’s T-test positive sorted cells vs negative sorted cells. Data represent mean and SEM relative to control. * p < 0.05. nd = not detected.

