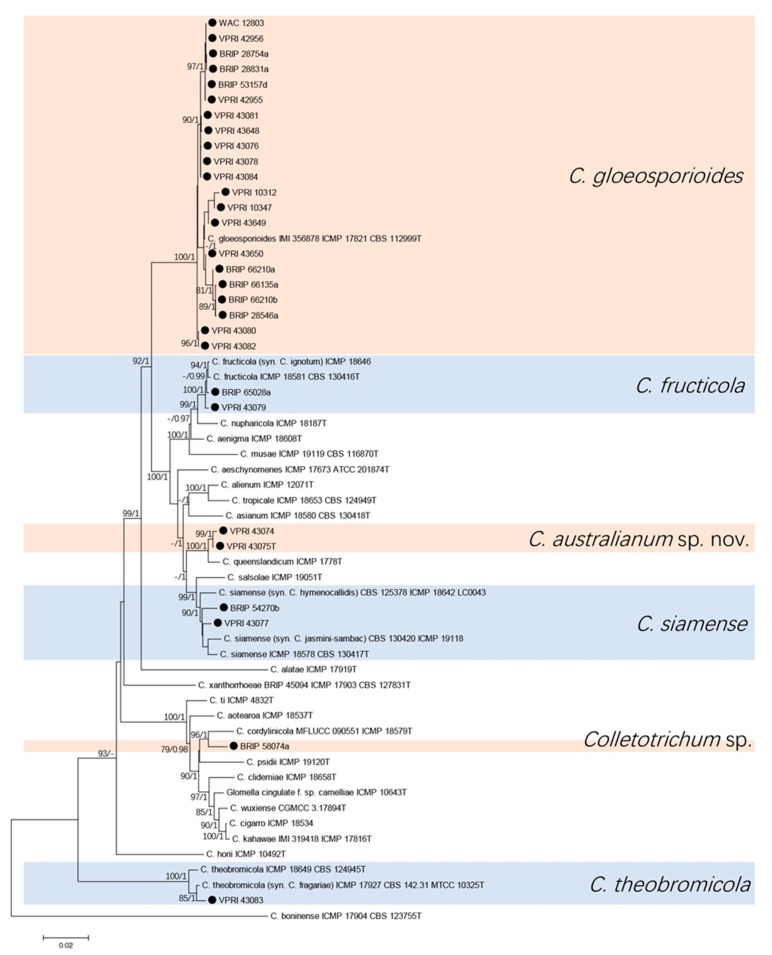
Figure 1.
Phylogenetic analysis of the combined ITS, gapdh, act, tub2, ApMat, GS, and chs-1 sequence alignment of Colletotrichum isolates in the gloeosporioides complex. The bootstrap support values (ML > 75%) of maximum likelihood analysis and Bayesian posterior probabilities (PP > 0.90) are displayed at the nodes (ML/PP). Black circle denotes isolates from Citrus spp.

