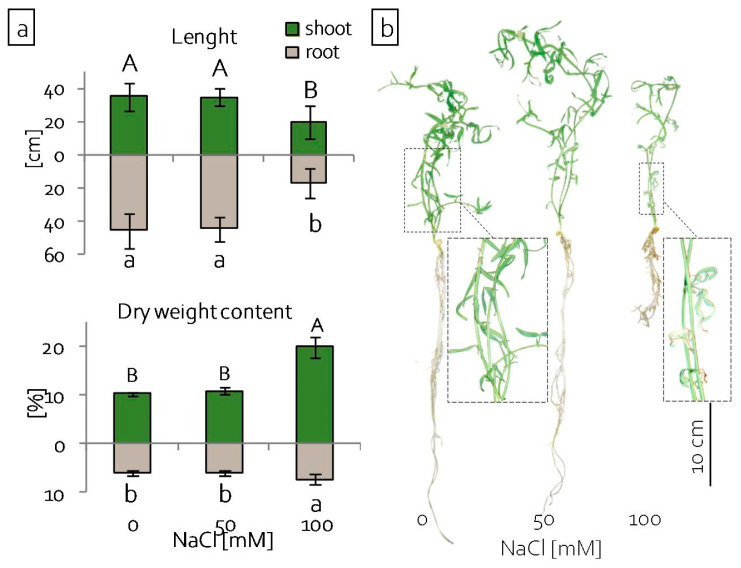
Figure 1.
Reaction of grass pea seedlings to salinity stress: (a) length (n = 30) and percentage of dry weight content of shoots and roots (n = 5); and, (b) morphology of shoots and roots; different letters—statistically significant differences within each organ (shoot-uppercase, root-lowercase) at p ≤ 0.05.

