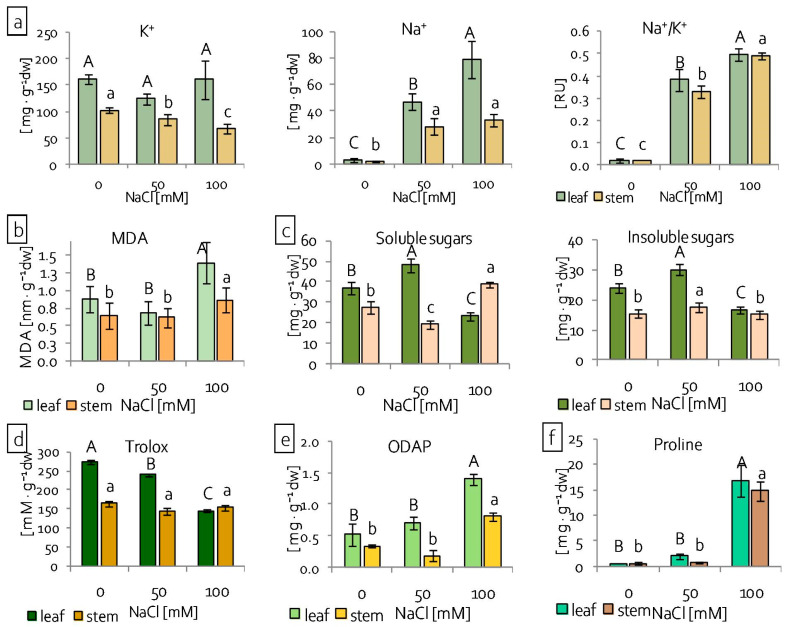
Figure 2.
Reaction of grass pea leaves and stems to salinity stress: (a) distribution of K+ and Na+ ions; (b) malondialdehyde (MDA) content; (c) content of soluble and insoluble sugars; (d) total antioxidant capacity (as Trolox equivalents); (e) content of β-N-oxalyl-L-α,β-diamino propionic acid (ODAP); and, (f) content of proline; different letters—statistically significant differences within each organ (leaf-uppercase, stem-lowercase) at p ≤ 0.05; (n = 5).

