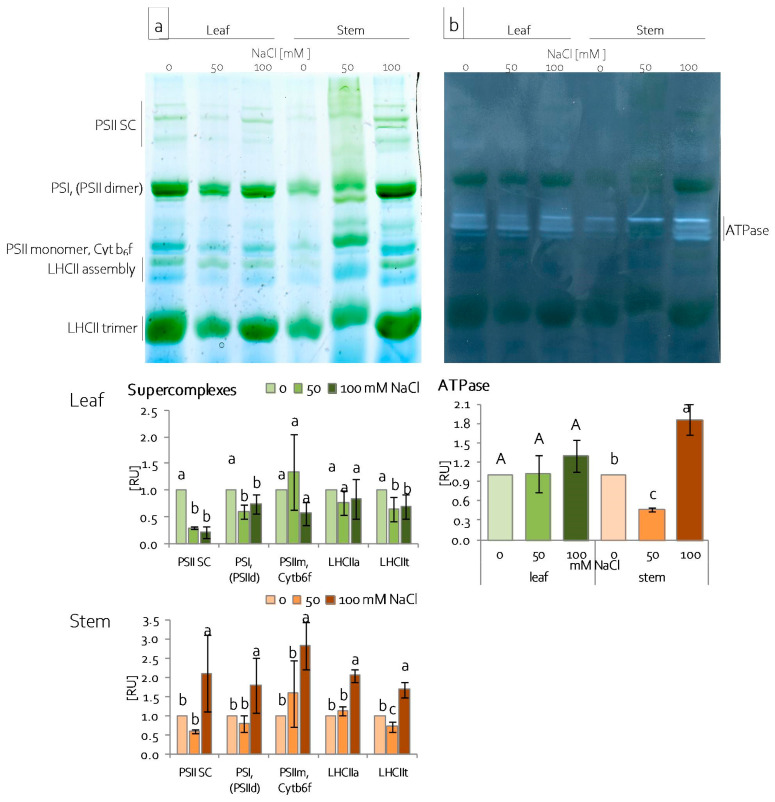
Figure 7.
Protein complex and supercomplex content (a) and ATPase activity (b) in leaf and stem chloroplasts under salinity; PSII—photosystem II, SC—supercomplex, PSIId—PSII dimer, PSI—photosystem I, PSIIm—PSII monomer, Cytb6f—cytochrome b6f, LHCIIa—LHCII assembly, LHCIIt—LHCII trimer; content of proteins expressed as relative units [RU]; different letters—statistically significant differences within each organ (leaf-uppercase, stem-lowercase) at p ≤ 0.05; (n = 3).

