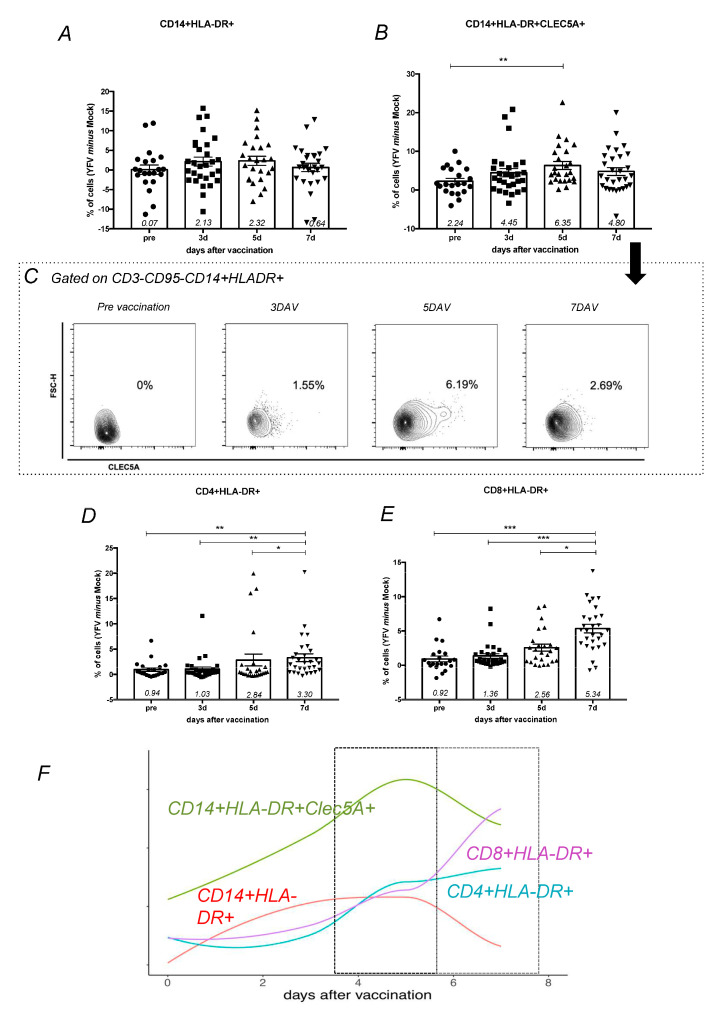
Figure 1.
Phenotypes of monocytes and T lymphocytes during vaccination follow-up. Peripheral blood mononuclear cells (PBMCs) from vaccinated volunteers (n = 38, 15 first time vaccinated and 23 s time vaccinated) were stimulated for 24 h with YF17DD in vitro. Bar-graphs show the cell population frequencies of (A) activated monocytes, represented as CD3−CD95−CD14+HLA-DR+, and (B) activated monocytes expressing CLEC5A, represented as CD3−CD95−CD14+HLA-DR+CLEC5A+. Cell population frequencies were calculated by frequency in YF17DD stimulated experimental condition minus frequency in unstimulated (mock) experimental condition. (C) Cells from one subject are represented as a density plot (FlowJo Tree Star®) showing the kinetics of CLEC5A expression on activated monocytes. (D) Activated CD4+ T cells are represented as CD3+CD95−CD4+HLA-DR+. (E) Activated CD8+ T cells are represented as CD3+CD95−CD4−HLA-DR+. Cell population frequencies were compared between time points using Kruskal–Wallis with Dunns post-test, with significant p value represented as * p < 0.05, ** p < 0.01, *** p < 0.001. Each point corresponds to one individual analyzed, with median and standard error of groups. (F) Graphic representation of cellular phenotypes during vaccination follow-up. Lines represent these percentage difference distributions over time for CD14+HLA-DR+CLEC5A+ (green), CD14+HLA-DR+ (red), CD8+HLA-DR+ (purple), and CD4+HLA-DR+ (turquoise).

