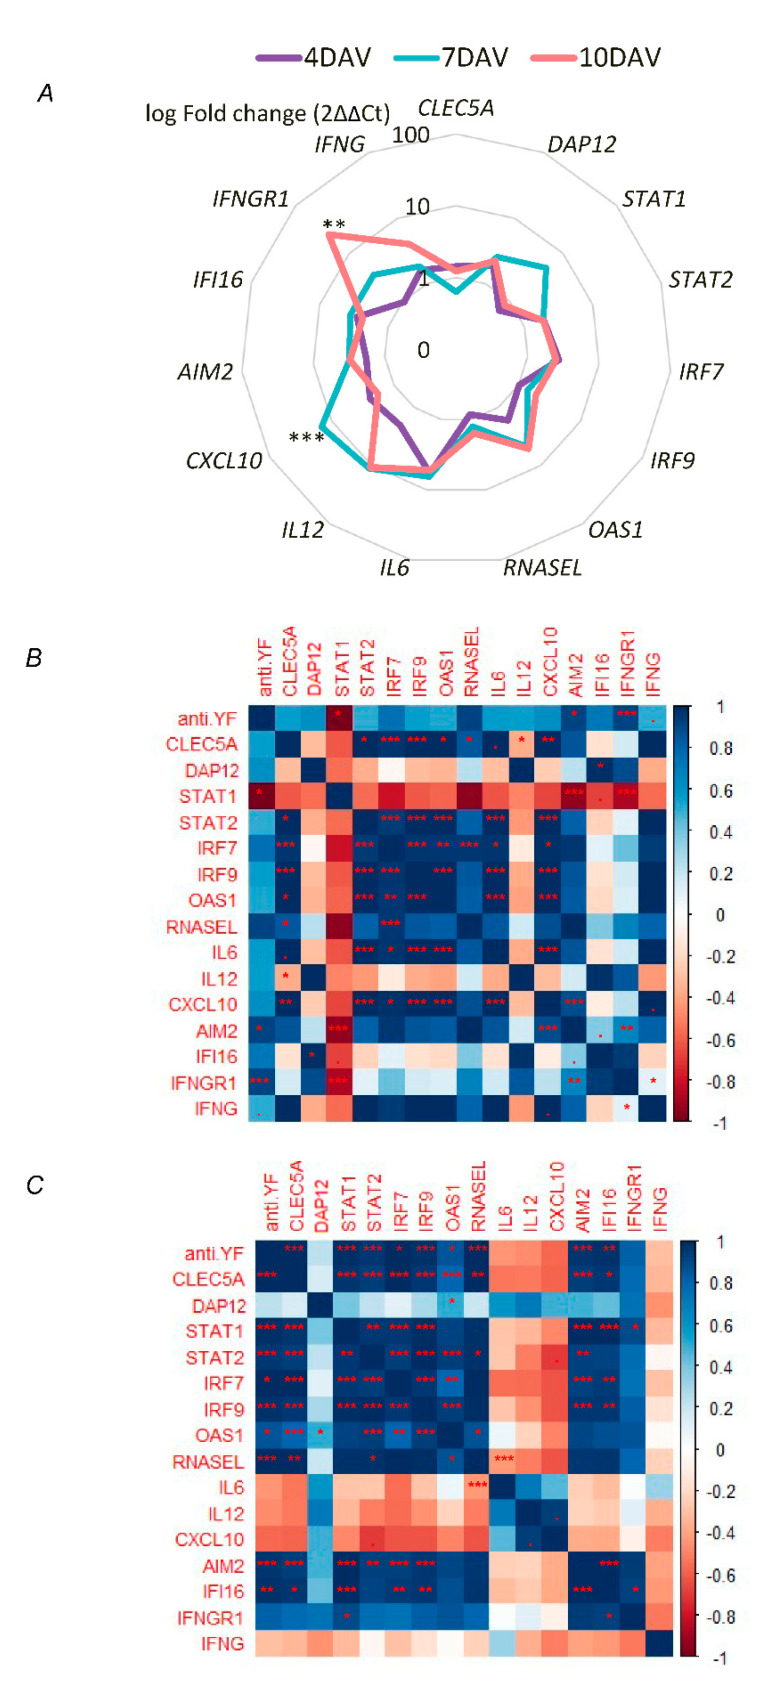
Figure 2.
Gene expression profile of the early responses in first time YF17DD-vaccinated volunteers (n = 15). (A) Radar chart representing the average log10 fold change (2ΔΔCt) of each gene and day after vaccination (DAV). Mean 2ΔΔCt values of CLEC5A, DAP12, STAT1, STAT2, IRF7, IRF9, OAS1, RNASEL, IL6, IL12, CXCL10, NOS1, AIM2, IFI16, IFNGR1, and IFNG clustered by 4 DAV (red), 7 DAV (yellow), and 10 DAV (blue). Fold change (2ΔΔCt) was compared between DAV by Kruskall–Wallis test with Dunn’s post-test using the GraphPad Prism 5 software. The heatmaps represent the correlation R values according to the Z score for 2ΔΔCt values of genes analyzed and anti-YF antibody production at (B) 7 DAV, and (C) 10 DAV. Spearman correlation and heatmaps by library “corrplor” from R-project. p value is represented as p < 0.1, * p < 0.05, ** p < 0.01, *** p < 0.001.

