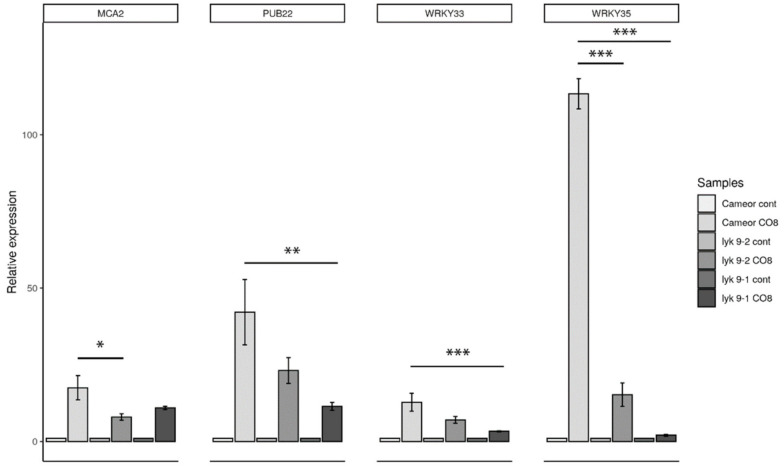
Figure 3.
Transcript levels of MCA2, PUB22, WRKY33 and WRKY35 defense response genes in pea roots treated with 10−5 M CO8-DA for 24 h. As a control, medium-treated plants were used. Relative expression was normalized against constitutively expressed ubiquitin and actin genes. For each gene, the transcript level in non-inoculated roots of wild-type or mutants was set to 1 (control), and that in treated roots was calculated relative to the control values. The graphs show the results of three independent experiments. The error bars represent SEM of three repeats. For one biological repeat, the fragments of non-inoculated main roots or nodules from 3–4 plants were collected and used to isolate RNA. The asterisks indicate statistically significant differences based on one-way analysis of variance (one-way ANOVA), followed by Tukey’s post-hoc test results. (* p < 0.05; ** p < 0.01, *** p < 0.001).

