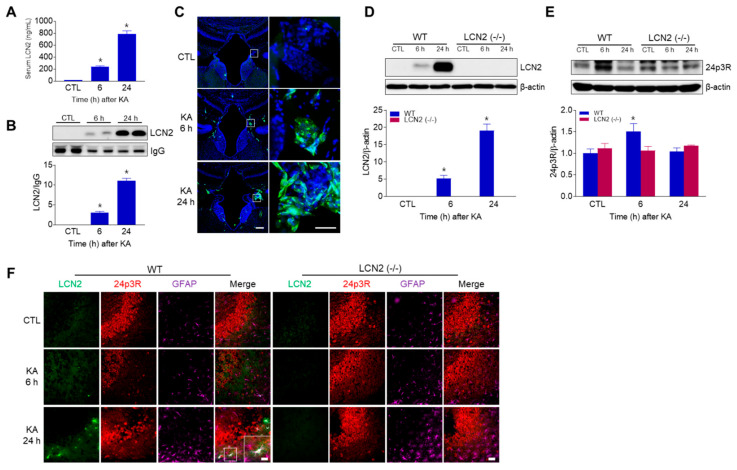
Figure 4.
LCN2 expressions in serum, choroid plexus, and hippocampus after i.p. administration of KA. (A) ELISA values for serum LCN2 levels in WT mice. Data are shown as mean ± SEM. * p < 0.05 vs. WT-CTL. (B) Western blot analysis and quantification for serum LCN2 expression in the hippocampus. IgG was used as a loading control. Data are shown as mean ± SEM. * p < 0.05 vs. WT-CTL. (C) Representative immunofluorescence images (×100) of the choroid plexus of the third ventricle showing LCN2 (green) and DAPI (blue) staining of nuclei. Scale bar = 50 µm (inset, 25 µm). Western blot analysis and quantitative expressions of LCN2 (D) and 24p3R (E) in the hippocampus. β-actin was used as a loading control. Data are shown as mean ± SEM. * p < 0.05 vs. WT-CTL. (F) Representative immunofluorescence images (×200) of hippocampal CA3 regions showing LCN2 (green), 24p3R (red), and GFAP (purple) staining. Scale bar = 25 µm.

