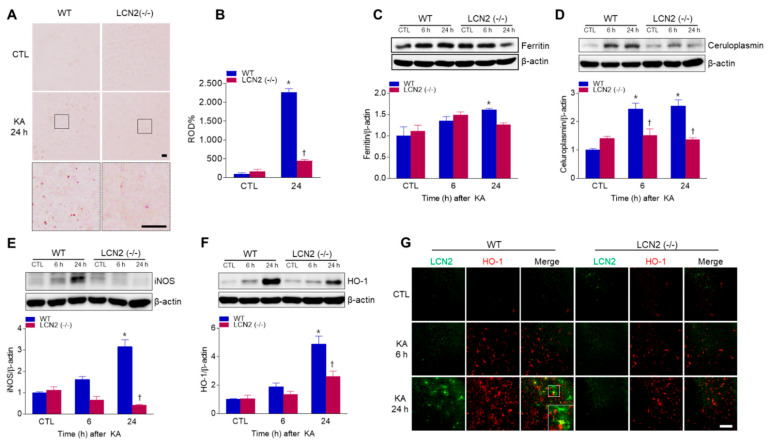
Figure 5.
Effects of LCN2 deficiency on iron accumulation and oxidative stress after KA administration. (A) Histological staining (×400) for iron with DAB-enhanced Perls’ staining in the hippocampal CA3 regions of WT and LCN2 (−/−) mice. Scale bar = 10 µm (inset, 10 µm). (B) Relative optical density (ROD) measurements (%) from DAB-enhanced Perls’ iron staining. Western blot analysis and quantitative expression of ferritin (C), ceruloplasmin (D), iNOS (E), and HO-1 (F) in the hippocampus. (G) Representative immunofluorescence images (×200) of hippocampal CA3 regions showing LCN2 (green) and HO-1 (red) staining. Scale bar = 25 µm. β-actin was used as a loading control. Data are shown as mean ± SEM. * p < 0.05 vs. WT-CTL. † p < 0.05 vs. WT + KA 6 h or WT + KA 24 h.

