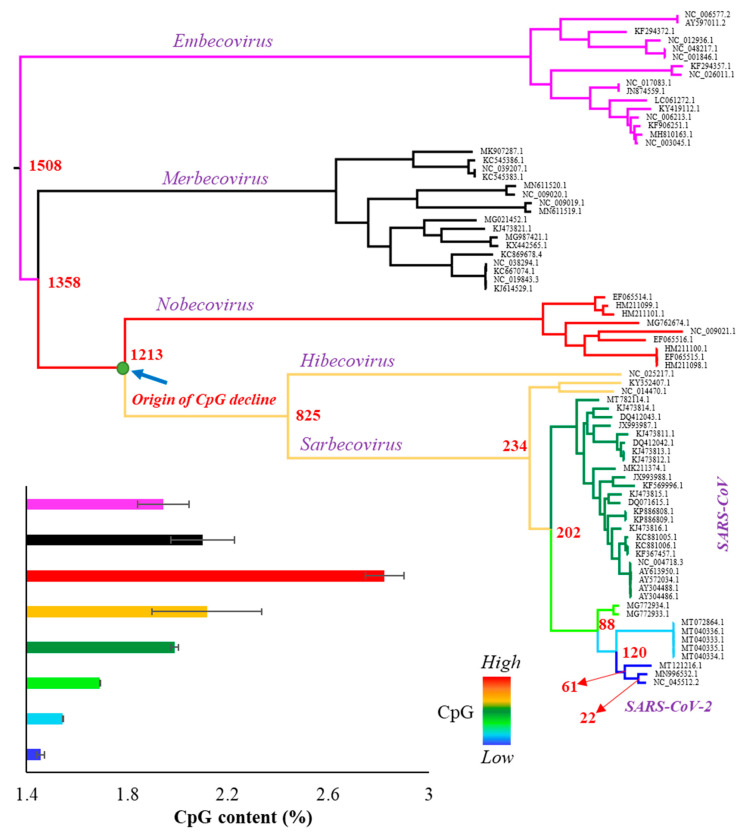
Figure 1.
Phylogenetic relationship among 79 representative genomes (Supplementary Table S1) belonging to the genus Betacoronavirus including severe acute respiratory syndrome coronavirus 2 (SARS-CoV-2) (NC_045512.2). The tree was inferred using the maximum likelihood method. Red to blue colors indicate the levels of CpG content: red (2.82%), orange (2.12%), dark green (1.98%), pale green (1.69%), sky blue (1.54%), and dark blue (1.46%). Bayesian MCMC method base was used to estimate the time of divergence for each node that are shown in red (Supplementary Figure S1). Inset: column graph showing the CpG contents (%) of various clades of the tree. Error bars indicate standard error of the mean.

