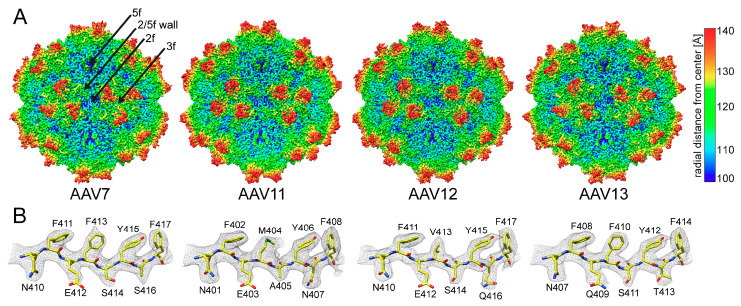
Figure 2.
The AAV7 and AAV11–13 capsid structures. (A) The capsid surface density maps contoured at a sigma (σ) threshold level of 2.0. The maps are radially colored (blue to red) according to distance to the capsid center, as indicated by the scale bar on the right. The icosahedral 2-, 3-, and 5-fold axes as well as the 2/5-fold wall are indicated on the AAV7 capsid map. (B) The AAV7 and AAV11–13 amino acids modeled for the βG strand are shown inside their respective density maps (black mesh). The amino acid residues are as labeled and shown in stick representation and colored according to atom type: C = yellow, O = red, N = blue, S = green. This figure was generated using UCSF-Chimera [48].

