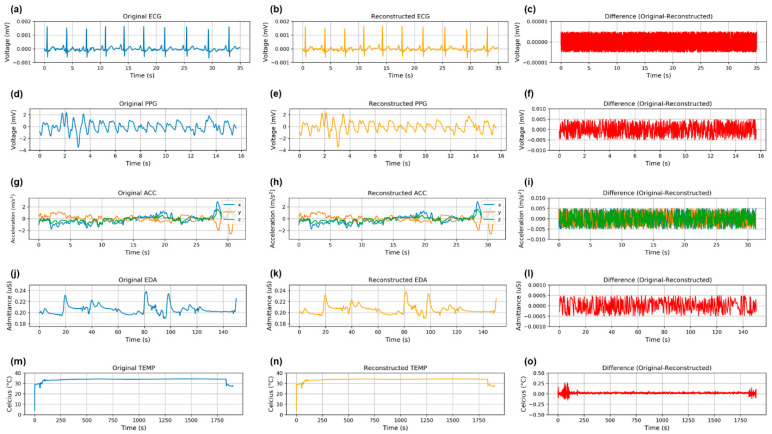
Figure 4.
Comparison of original, reconstructed, and difference between original and reconstructed signals for ECG (a–c), PPG (d–f), ACC (g–i), EDA (j–l), and TEMP (m–o). These plots were constructed for the method that minimized the PRD: DDC with HE for ECG, PPG, ACC; SVD with HE for EDA; BD-WT with HE for TEMP. This figure enables visualization of the signal characteristics and corresponding differences between original and reconstructed signals.

