Figure 3.
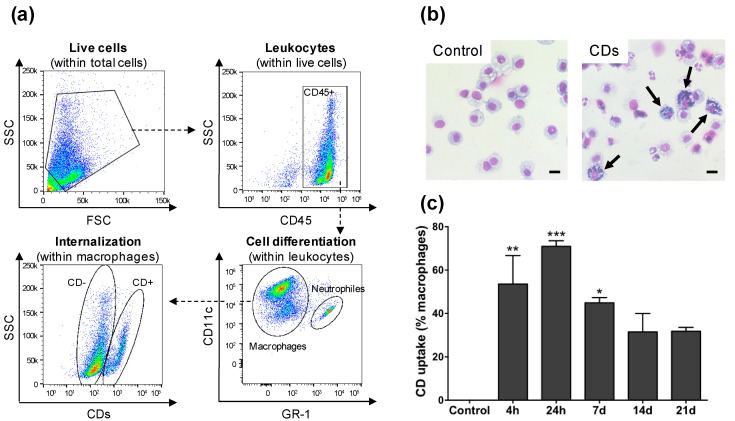
Uptake of CDs by cells of the airway lumen as studied by FACS (a,c) or optical microscopy (b). Mice received one administration of CDs (100 µg) or saline, and BALFs were collected 4 h, 24 h, 7 d, 14 d, or 21 d later. (a) Gating strategy to identify the cell types present in BALFs and to measure CD cell uptake by FACS (data from the 4-h time point). (b) Cells recovered from BALFs of control mice (left) or mice exposed to 100 µg CDs at the 4-h time point (right) as observed by optical microscopy. The arrows show macrophages loaded with CDs (scale bar = 10 µm). (c) Kinetics of internalization of CDs by alveolar macrophages as assessed by FACS. Data are means ± SEM of n = 3 mice. Statistical differences when compared to controls were determined by ANOVA followed by the Dunnett’s test. * p < 0.05; ** p < 0.01; *** p < 0.001.

