Figure 5.
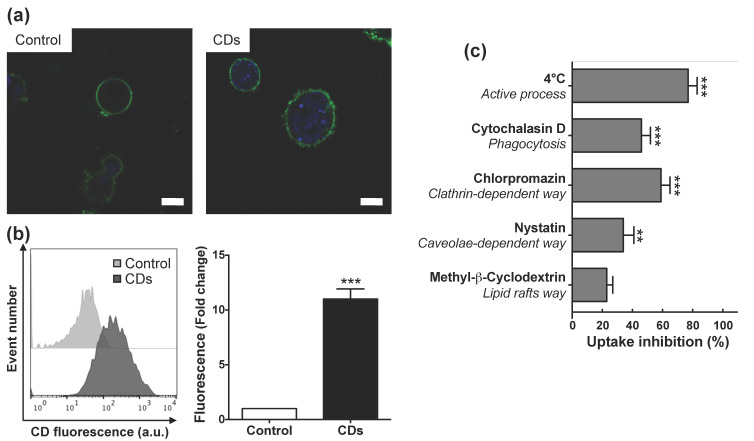
Uptake of CDs in cultured macrophages as assessed by CLSM or FACS. (a) CLSM analysis of unexposed cells (left) or cells exposed to 25 µg/mL of CDs for 4 h (right). Cells were stained with the fluorescent membrane probe DSQ12S before observation. Cell membrane is colored in green and CDs appear in blue (scale bar = 10 µm). (b) Quantification of CD internalization by FACS. Results are expressed as fold change in fluorescence intensity when compared to control cells and are means ± SEM of n = 9 experiments. Statistical differences when compared to control were determined by Student’s t-test. *** p < 0.001. (c) Study of CD internalization mechanisms by FACS. Cells were pre-incubated at 4 °C or pre-treated with various pharmacological inhibitors for 30 min before the addition of CDs (25 µg/mL). Internalization was measured at 4 h. Results were expressed as percent of inhibition of CD uptake and are means ± SEM of n = 3 experiments. Statistical differences when compared to control were determined by ANOVA followed by the Dunnett’s test. ** p < 0.01; *** p < 0.001.

