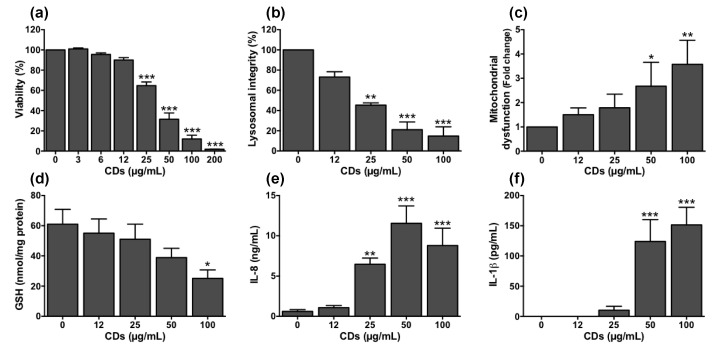
Figure 6.
Cellular mechanisms involved in the toxicity of CDs towards cultured macrophages. Cells were exposed or not with increasing concentrations of CDs for 24 h (a,b,e,f) or 4 h (c,d). Cell viability (a, MTT assay), lysosomal integrity (b, neutral red assay), mitochondrial dysfunction (c, mitochondrial membrane perturbation assay), oxidative stress (d, reduced glutathione), inflammatory response (e, IL-8 secretion) and NLRP3 inflammasome activation (f, IL-1β secretion) were measured at 4 h (c,d) or 24 h (a,b,e,f). Data are means ± SEM of n = 3–6 experiments. They are expressed in percentage of controls (a,b), fold change (c), or as absolute values (d–f). Statistical differences when compared to controls were determined by ANOVA followed by the Dunnett’s test. * p < 0.05; ** p < 0.01; *** p < 0.001.

