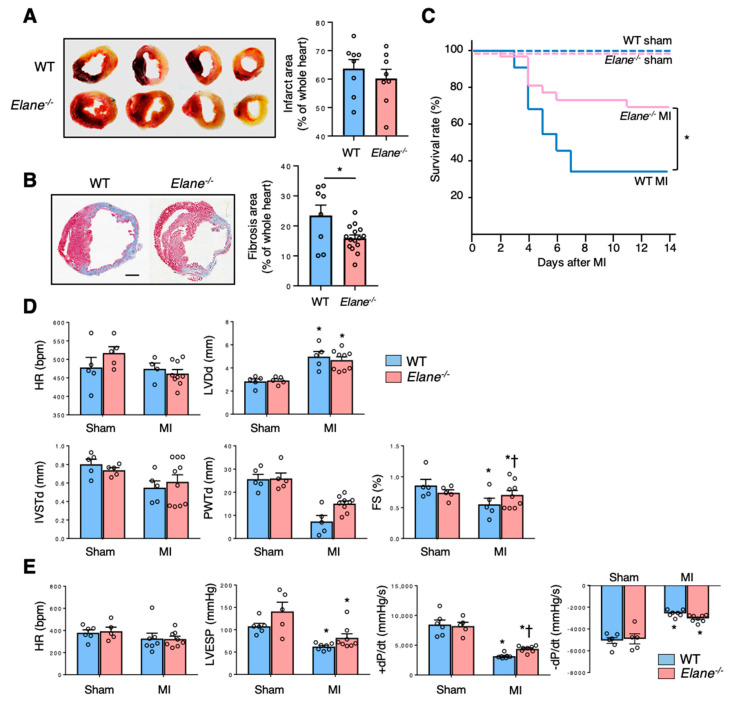
Figure 2.
NE deletion improved survival and cardiac function post-MI. (A) Twenty-four hours post-MI, the hearts were removed and stained with 2,3,5-triphenyltetrazolium chloride for measurement of infarct area. Viable parts of the heart appear red, while the infarct area appears white. The bar graph represents quantification of infarct area as a percentage of the whole heart. Results are presented as mean ± SEM, n = 8 each. (B) Representative Masson’s trichrome staining images of the hearts from WT and Elane−/− mice on day 7 post-MI. The bar graph shows quantification of fibrosis area as a percentage of the whole heart. Results are presented as mean ± SEM, n = 8–15 each, * p < 0.05. (C) Kaplan–Meier survival analysis 14 days post-MI or sham operation. Blue line indicates WT with MI (n = 22), red line indicates Elane−/− with MI (n = 26), dotted blue line indicates WT with sham operation (n = 8), and dotted red line indicates Elane−/− with sham operation (n = 7). * p < 0.05 by log rank. (D) Bar graphs represent echocardiographic parameters from the indicated mice. Results are presented as mean ± SEM, n = 5–9 each, * p < 0.05 vs. sham and # p < 0.05 vs. WT. (E) Bar graphs represent hemodynamic parameters 14 days post-MI. Results are presented as mean ± SEM, n = 5–8 each, * p < 0.05 vs. sham and † p < 0.05 vs. WT.

