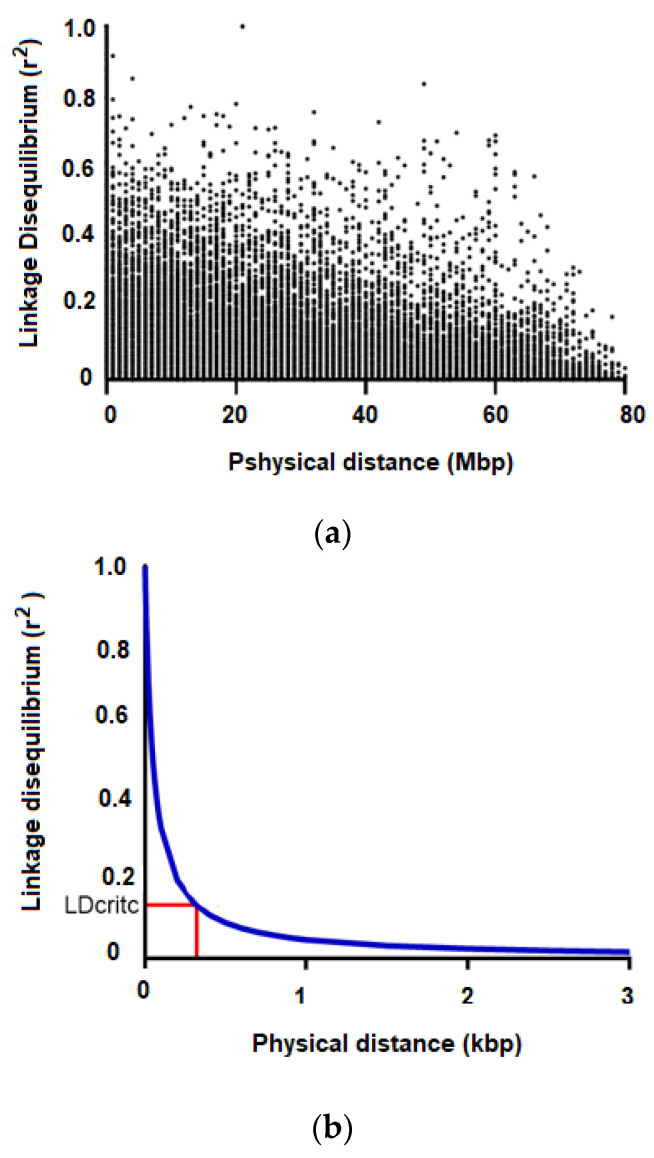
Figure 3.
Linkage disequilibrium (LD) pattern throughout the E. cladocalyx genome. (a) LD values (r2) between all combinations of SNP pairs as a function of physical distance (in Mpb). (b) LD decay curve as a function of physical distance (in kbp). LDcritc corresponds to the critical value of r2, as an evidence of linkage, which is shown by red lines.

