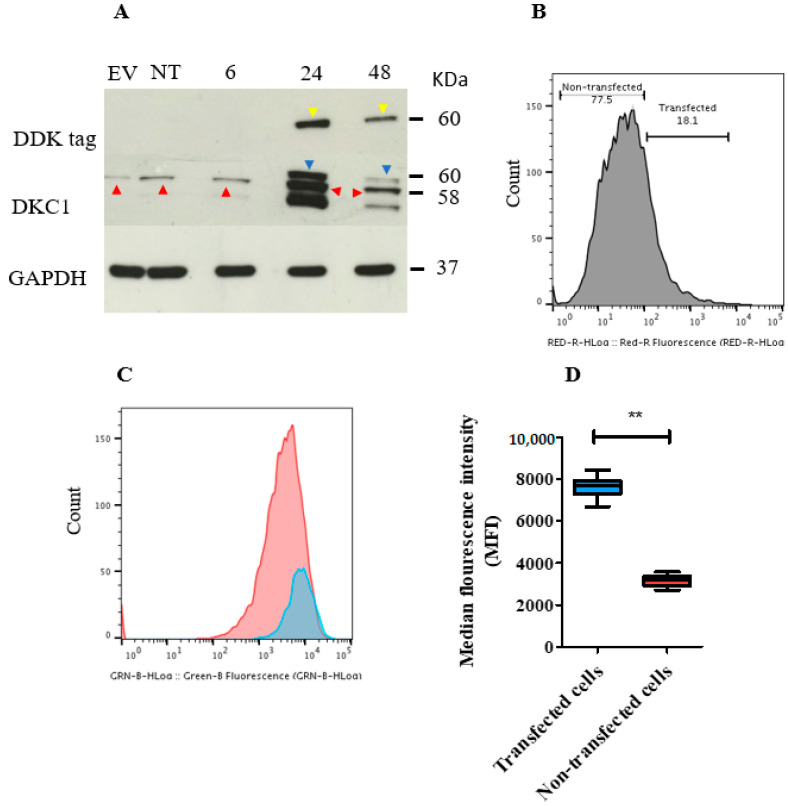
Figure 6.
Transient overexpression of DKC1 in ISK cells. The plasmid and the empty vector (EV) used were tagged with the synthetic DYKDDDDK (DDK) protein to discern the transfected cells by using an anti-DDK antibody. (A) Immunoblot showing the level of dyskerin protein in DKC1 and EV transfected and non-transfected (NT) ISK cells. Cells were harvested 6, 24, and 48 h following transfection. Endogenous and exogenous dyskerin bands were present at the molecular weight of 58 and 60 KDa (red and blue arrows, respectively). DDK bands (yellow arrows) were observed at 60 KDa. Glyceraldehyde 3-Phosphate Dehydrogenase (GAPDH) bands were at 37 KDa. (B) Flow cytometric histogram showing the level of DDK tag protein in ISK cells. Cells positively stained with anti-DDK tag antibody represent transfected cells. (C) Cell proliferation was analysed using flow cytometry. ISK cells were stained with CellTrace Carboxyfluorescein Diacetate Succinimidyl Ester (CFSE) and fluorochrome-conjugated DDK Tag Antibody. Transfected cells (blue curve) and non-transfected cells (red curve). Higher proliferation is suggested when the curve was shifted to the left. (D) The difference in median fluorescence index (MFI) between transfected (T) and non-transfected ISK cells. ** p < 0.01, Wilcoxon signed-rank test.

