Figure 4.
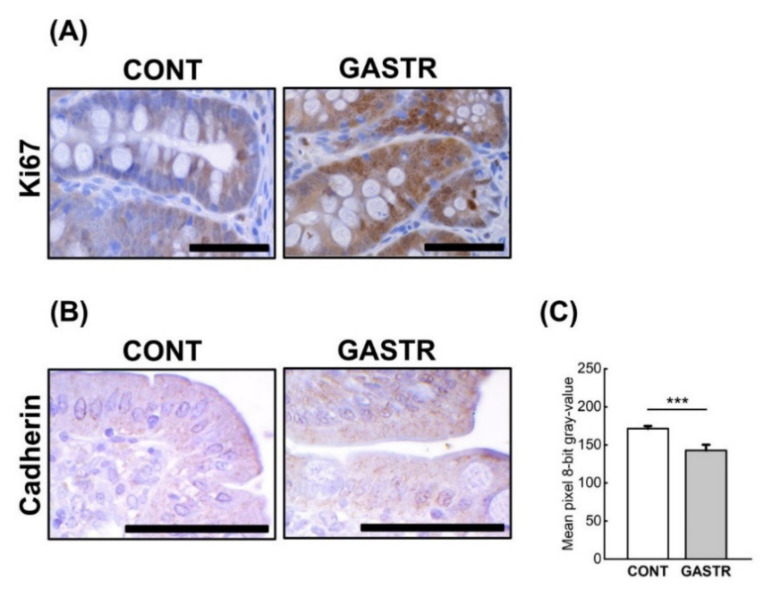
(A) Representative photomicrographs of the immunohistochemical reactions for Ki-67 in the jejunum. (B) Representative pictures of the immunohistochemical reactions for cadherin in the sections of the jejunum. Sections were developed in 3,3′-diaminobenzidine tetrahydrochloride (DAB); counterstaining was performed with Mayer’s hematoxylin. All the scale bars represent 50 μm. (C) The intensity of expression of cadherin in the jejunum, measured by the quantitative assessment of mean pixel intensity values in the photomicrographs converted to 8-bit grayscale images. The scale was from 0 (white pixel) to 255 (black pixel); the lower the pixel value, the higher the intensity of immunohistochemical reaction. Graph shows mean ± standard error. Significance was established using a two-tailed Student’s t-test (normally distributed data), Welch’s test (normally distributed data with unequal variances) or the Mann–Whitney test (for pairwise comparisons with at least one non-normally distributed dataset); *** p < 0.001.

