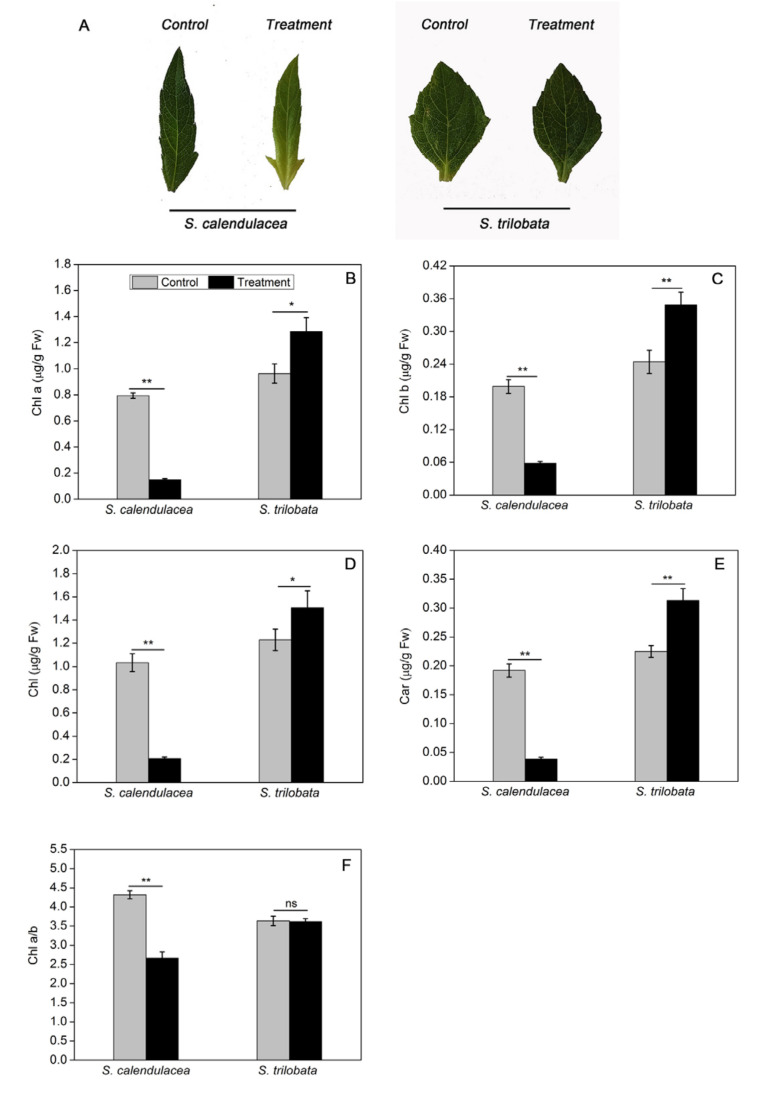
Figure 1.
Effect on appearance (A), Chl a (B), Chl b (C), Chl (D), Car (E) content and Chl a/b (F) in two Sphagneticola species under HT treatment (35 ± 1 °C). The data represent the mean ± SE (n = 5). Asterisks above columns indicate statistical significance for comparisons between HT and room temperature. (** p < 0.01 and * p < 0.05).

