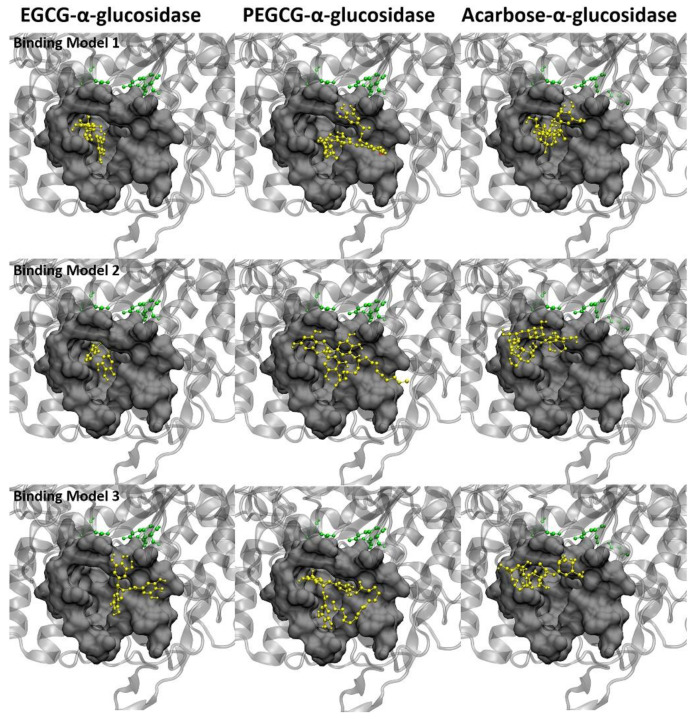
Figure 5.
Top 3 predicted binding models of the ligands with α-glucosidase. Protein is shown in silver in the cartoon model. Drugs are shown in yellow. The catalytic sites are displayed in green. The ligand molecules are represented in yellow. Amino acids in contact are displayed in the surface model. The red and blue dotted lines stand for hydrogen bonds.

