Fig. 1.
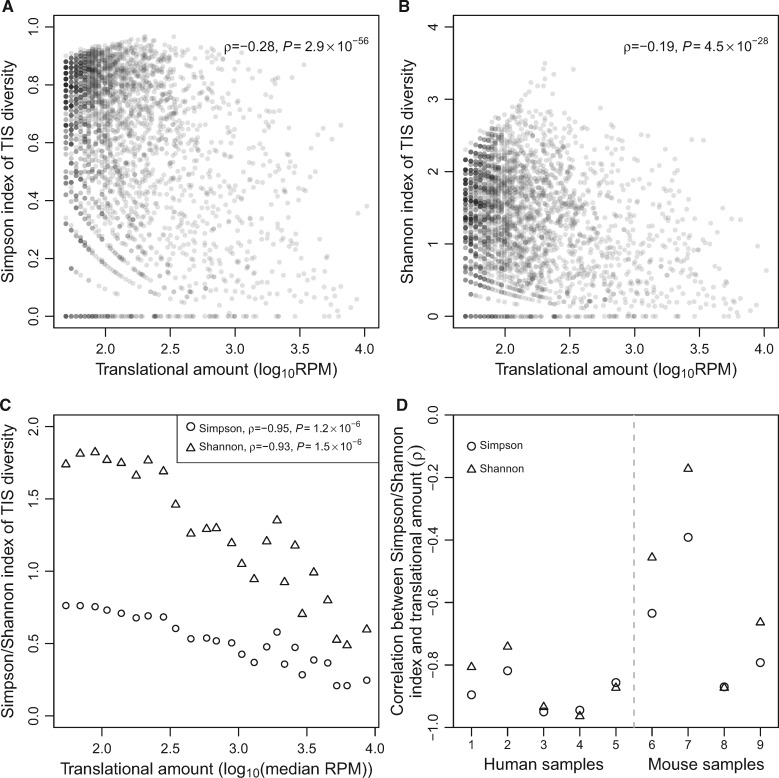
TIS diversity of a gene generally decreases with the translational amount of the gene. (A) The Simpson index of TIS diversity in human HEK293 cells declines with the translational amount. (B) The Shannon index of TIS diversity in human HEK293 cells declines with translational amount. In (A) and (B), each dot represents a gene. Spearman’s rank correlation coefficient (ρ) and associated P value are presented. RPM, number of QTI-seq reads mapped to a given gene per million reads mapped to all genes in the sample. (C) Simpson and Shannon indices of TIS diversity in HEK293 decline with translational amount. Each triangle/circle represents a supergene that is composed of many individual genes. All supergenes have the same total translational amount. X-axis shows the median translational amount of all genes belonging to the supergene. (D) Spearman’s correlation between median translational amount and Simpson or Shannon index of TIS diversity among supergenes in each sample examined. Sample IDs listed in the X-axis refer to those in supplementary table S1, Supplementary Material online. P < 0.05 for all correlations except for the mouse liver under fasting (sample #7).

