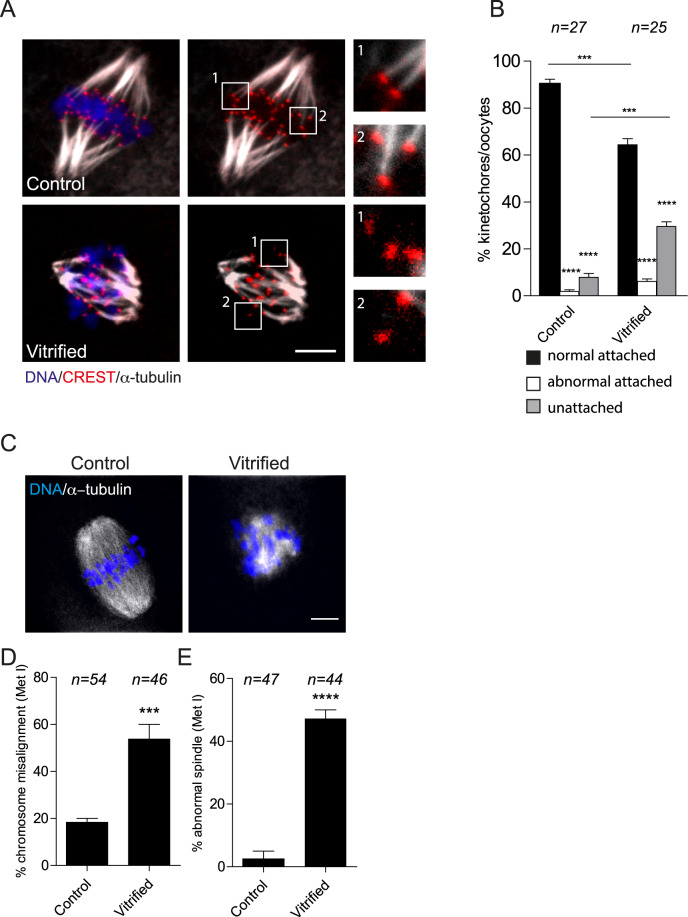
Figure 2.
Effect of mouse oocyte vitrification on metaphase I (Met I). Fresh and vitrified/thawed GV oocytes underwent IVM for 7 h until Met I. (A) Representative confocal images from the cold-stable microtubule assay from the indicated treatment groups. Kinetochores were detected with CREST anti-sera (red), microtubules with an anti-α-tubulin antibody (white) and DNA with DAPI (blue). The scale represents 10 μm. (B) Quantification of images in A. The data are expressed as mean ± SEM; one-way ANOVA was used to analyze the data. Values with asterisks vary significantly, ***P < 0.001, ****P < 0.0001. Unless otherwise specified, asterisks above each group denote the statistical analysis of P-value against the ‘normal attached’ group. (C) Met I oocytes were fixed and stained with an anti-α-tubulin antibody (white) to detect spindles and DAPI to detect DNA (blue) using confocal microscopy. The confocal images were quantified for the percentage of misaligned chromosomes (D) and abnormal spindle morphology (E). The scale represents 10 μm. The data are expressed as mean ± SEM; χ2 contingency test was used to analyze the data. Values with asterisks vary significantly, ***P < 0.001, ****P < 0.0001. The total number of analyzed oocytes in each group (from two independent replicates) is specified above each condition within each graph. Unless otherwise specified, asterisks above each group denote the statistical analysis of P-value against the control group

