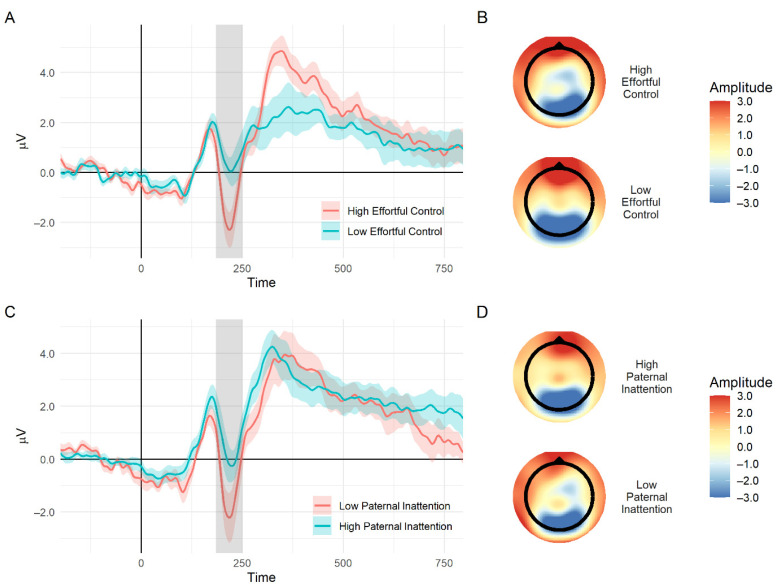
Figure 4.
(A) An event-related potential wave plot of the difference between successful stop and successful slow go for adolescents with high and low ratings of childhood effortful control (group divided into lower and upper quartiles for illustration purpose). The gray area delineates the N2 time window; the shaded area represents standard errors. (B) Topographic maps of voltages on the scalp at the N2 time window (specifically at 200 ms after stop-signal presentation) for high (top) and low (bottom) childhood effortful control. (C) An event-related potential wave plot of the difference between a successful stop and successful slow go for adolescents with high and low paternal inattention symptoms (group defined by the lower and upper quartile). (D) Topographic maps of voltages on the scalp at the N2 time window for high (top) and low (bottom) paternal inattention.

