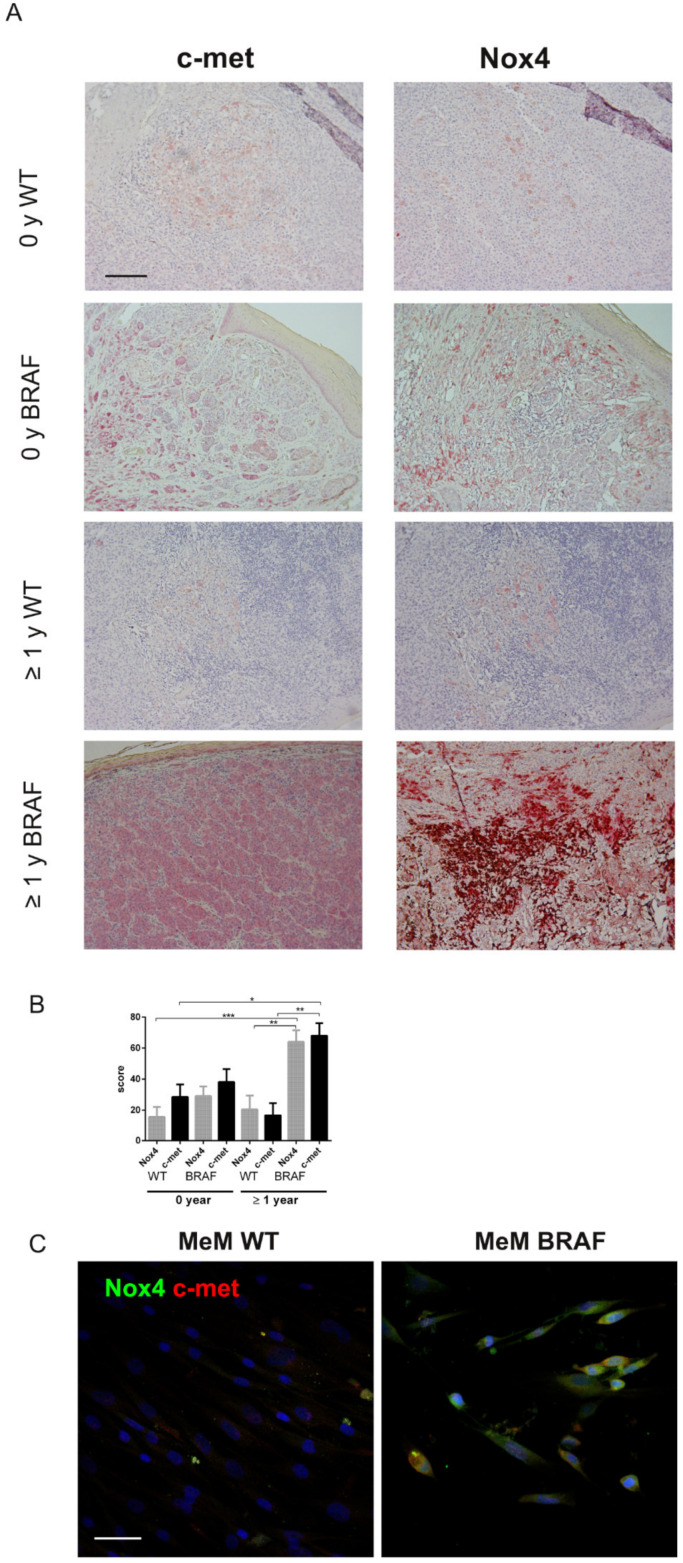
Figure 2.
Nox4 and c-met expression in BRAF mutated primary melanoma. (A) Representative images of Nox4 and c-met IHC staining (red staining) in primary MeM WT or BRAF mutated. MeM at the time of the diagnosis (0 y) or that developed metastasis after at least 1 year (≥1 y) are shown. Scale bar = 500 µm. (B) Percentage of positive cells analyzed by 3 operators are shown in the graphs. * p-value < 0.05; ** p-value < 0.01; *** p-value < 0.001. (C) Representative images with DAPI (blue), Nox4 (green) and c-met (red) signals of MeM WT or BRAF mut primary cells. Scale bar = 20 µm.

