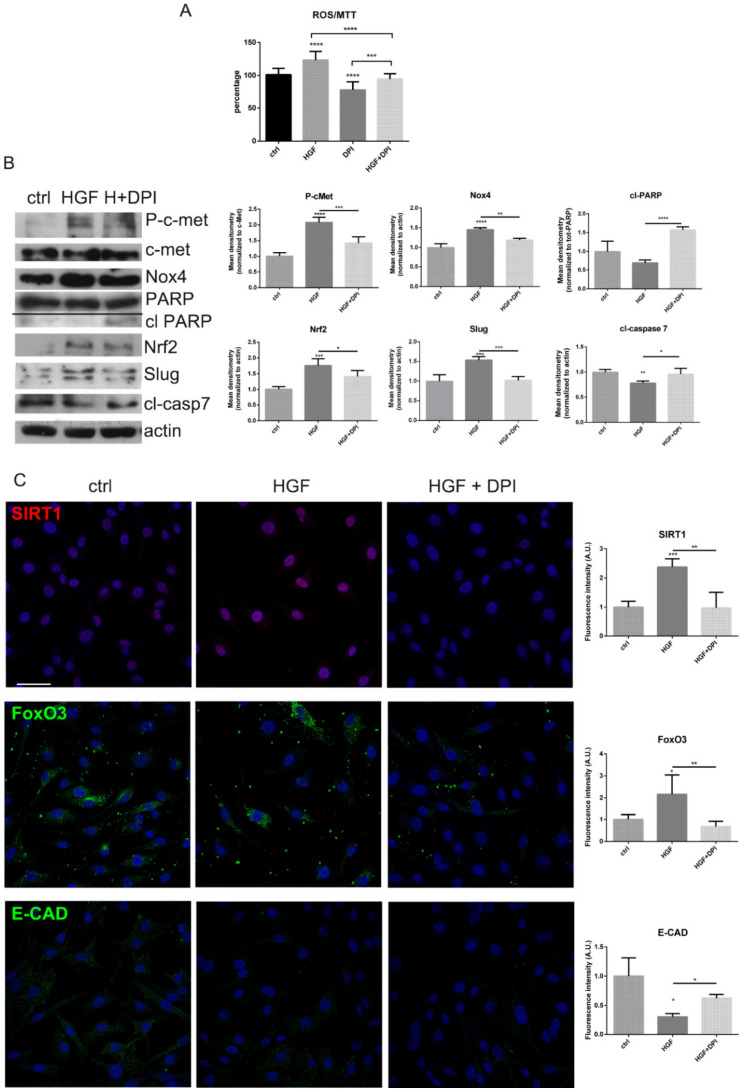
Figure 4.
Nox4 and c-met modulation in SK-MEL-28 cells. (A) Graph showing ROS levels normalized to MTT values of measured in SK-MEL-28 cells treated with DPI up to 1 µM for 6 h in the presence or absence of HGF. *** p-value < 0.001; **** p-value < 0.0001. (B) Western blot analysis of total lysate of SK-MEL-28 cells treated or not with DPI in the presence of HGF, then revealed with anti-p-c-met, anti-c-met, anti- PARP, anti-Nox4, anti-Nrf2, anti-Slug, anti-cleaved caspase 7, and anti-actin as a loading control. The graphs represent the mean ± SD of densitometric analysis of three experiments, normalized to actin or c-met or total PARP values. * p-value < 0.05; ** p-value < 0.01; *** p-value < 0.001; **** p-value < 0.0001. (C) Representative images with DAPI (blue), FoxO3 or E-CAD (green) or SIRT1 (red) signals of SK-MEL-28 treated as previously reported. Scale bar = 20 µm. Fluorescence intensity of cells visualized in 5 fields for each condition are shown in the graphs. * p-value < 0.05; ** p-value < 0.01; *** p-value < 0.001.

