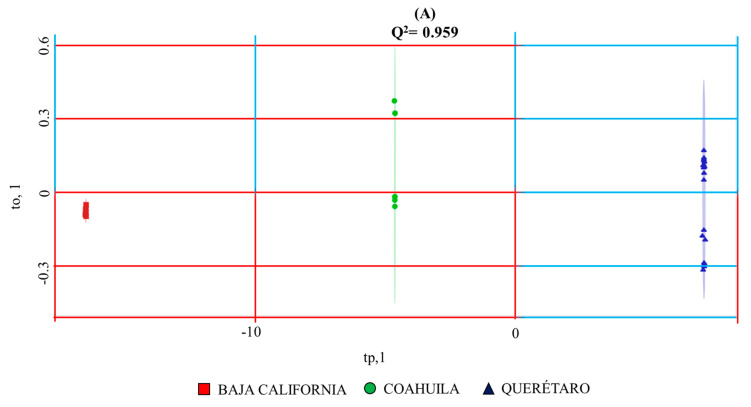
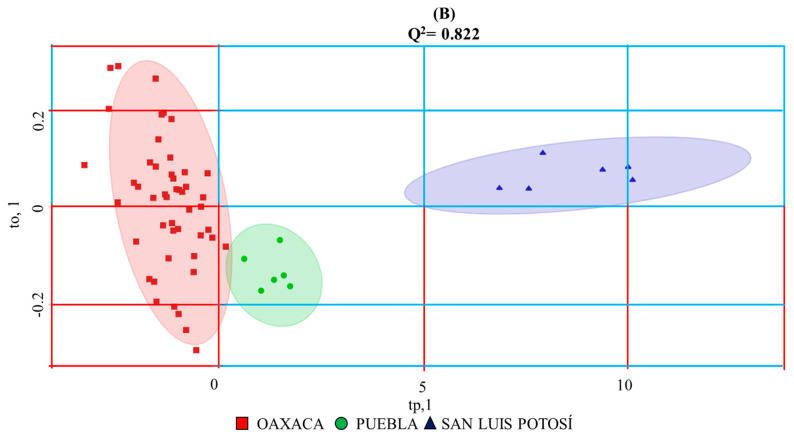
Figure 2.
OPLS-DA multivariate statistical analysis score plots generated from 1Hwater_presat NMR data matrix (Figure 1) considering the regional factor of wines (A) and mezcals (B) described in Table 1 and Table 2. T2 Hotelling’s ellipses have a 95% confidence level. Prediction accuracy curves as a function of PLS components, permutation tests, PCA analysis obtained from the same NMR data matrix and OPLS-DA loading plots of wines’ and mezcal’ analysis can be consulted, respectively, in Figures S2 and S3.


