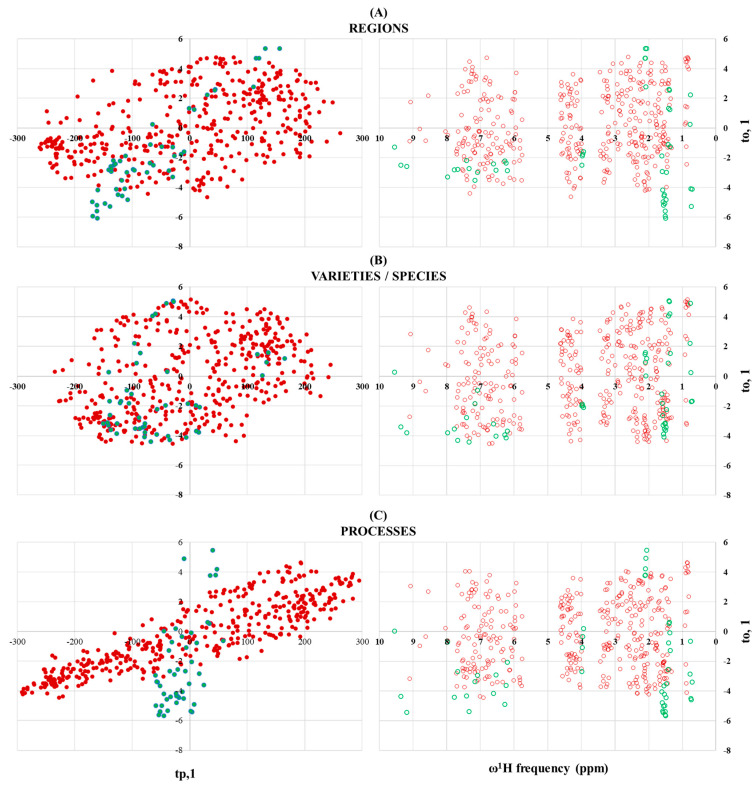
Figure 5.
OPLS-DA loading plots of wine (red dots) and mezcal (green dots) regional (A), varieties/species (B) and processes (C) discriminant factors. Orthogonal components (to,1) are expressed as a function of predictive components (tp,1, left plots) and proton chemical shifts (ω1H frequency, left plots) from wines’ and mezcals’ NMR data matrices.

