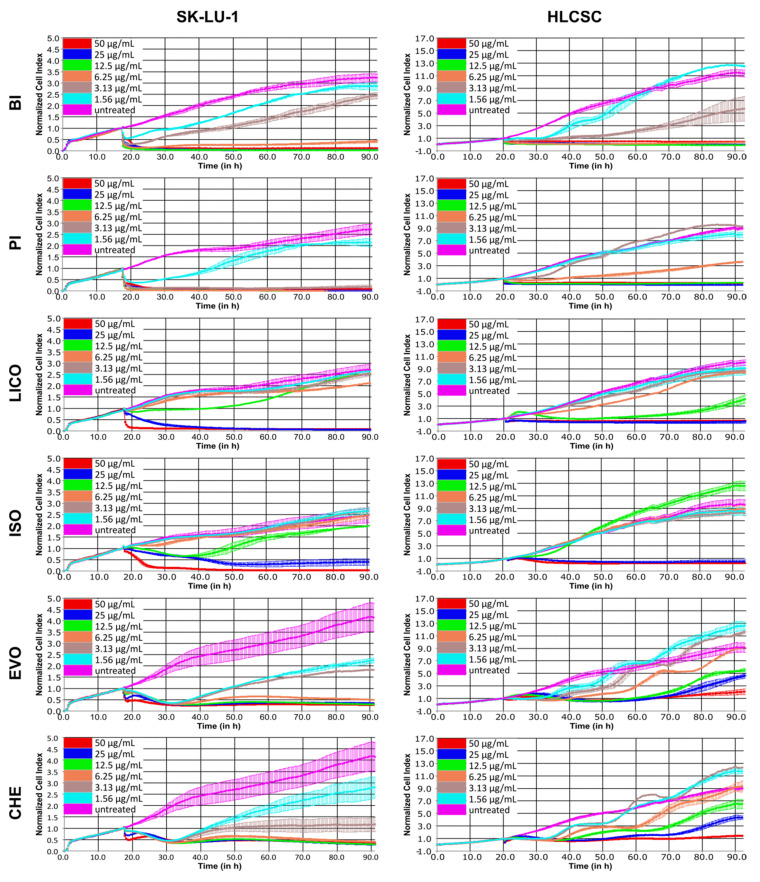
Figure 1.
Dose–response curves depicting growth inhibitory kinetics of phytochemicals representatives of alkaloids, chalcones and isothiocyanates in SK-LU-1 and HLCSC. Various phytochemicals were administered at indicated concentrations after initial overnight growth, and the growth was continuously monitored for at least 72 h post-treatment. Curves presented are representative curves from two independent experiments. Error bars are expressed as mean ± SD from duplicated wells.

