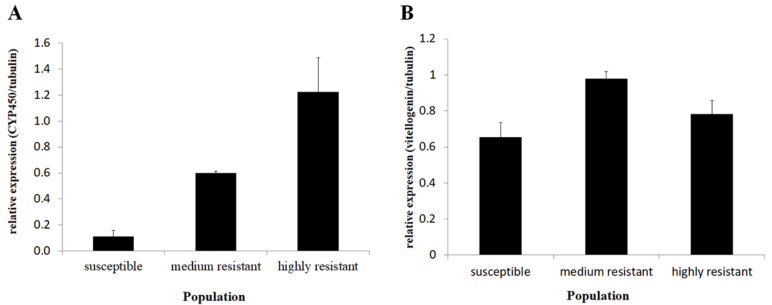
Figure 5.
(A) Cytochrome P450 (CL844) relative expression levels in the three lab populations. The quantification was conducted using qRT-PCR (ANOVA, n = 4, df = 2, p = 0.002). (B) Relative expression levels of vitellogenin (CL1604) in the three thrip populations. Quantification was done using qRT-PCR (ANOVA, n = 4, df = 2, p = 0.022).

